گزارش و amp; بررسی اجمالی نظارت
با مجموعهها، منظم بمانید
ذخیره و طبقهبندی محتوا براساس اولویتهای شما.
مهم است که به طور منظم استفاده، سهمیه و اطلاعات صورتحساب پلتفرم Google Maps خود را مرور کنید. این اطلاعات به شما کمک میکند میزان استفاده از API را اندازهگیری کنید، در محدوده مصرف از پیش تعریفشده قرار بگیرید و هزینهها را از طریق بودجههای برنامهریزیشده کنترل کنید. مرور این اطلاعات همچنین میتواند شما را از هرگونه تعامل غیرمنتظرهای که ممکن است بین برنامههای شما و سرویسهای پلتفرم Google Maps رخ دهد، آگاه کند.
پلتفرم Maps دو ابزار را ارائه میکند که میتواند به شما در بررسی اطلاعات استفاده، سهمیه و صورتحساب کمک کند:
- گزارش : مجموعه ای از گزارش های بصری از پیش تعریف شده که به شما امکان می دهد به راحتی استفاده، سهمیه و اطلاعات صورتحساب پایه API را در کنسول Google Cloud مشاهده کنید. میتوانید به سرعت تعداد تماسهای API را تعیین کنید، ببینید چقدر به سهمیههای استفاده از API نزدیک شدهاید و میزان استفاده از صورتحساب را در طول زمان نظارت کنید.
نظارت : مجموعهای از ابزارها، هم در کنسول Cloud و هم از طریق یک API، که به شما امکان میدهد استفاده، سهمیه و اطلاعات صورتحساب API را نظارت کنید و زمانی که هر یک از این معیارها به یک حد از پیش تعریفشده نزدیک شد، هشدارها را تعریف کنید.
مانیتورینگ به شما امکان می دهد داشبوردهای نظارتی سفارشی خود را ایجاد کنید که معیارهای شما را به صورت انواع نمودارهای مختلف نمایش می دهد. همچنین میتوانید اعلانهای هشدار مانند ایمیلها یا پیامهای متنی SMS را هنگامی که یک معیار از آستانه از پیش تعریف شده عبور میکند، صادر کنید.
گزارش دهی
گزارشدهی در پلتفرم Maps مجموعهای از گزارشهای بصری از پیش تعریفشده را ارائه میدهد که به شما امکان میدهد به راحتی استفاده، سهمیه و اطلاعات صورتحساب پایه API را در کنسول Cloud ببینید. با استفاده از کنسول Cloud، گزارشهای مربوط به استفاده، سهمیه و شمارههای صورتحساب Maps Platform خود را مشاهده کنید.
گزارشهای API و خدمات
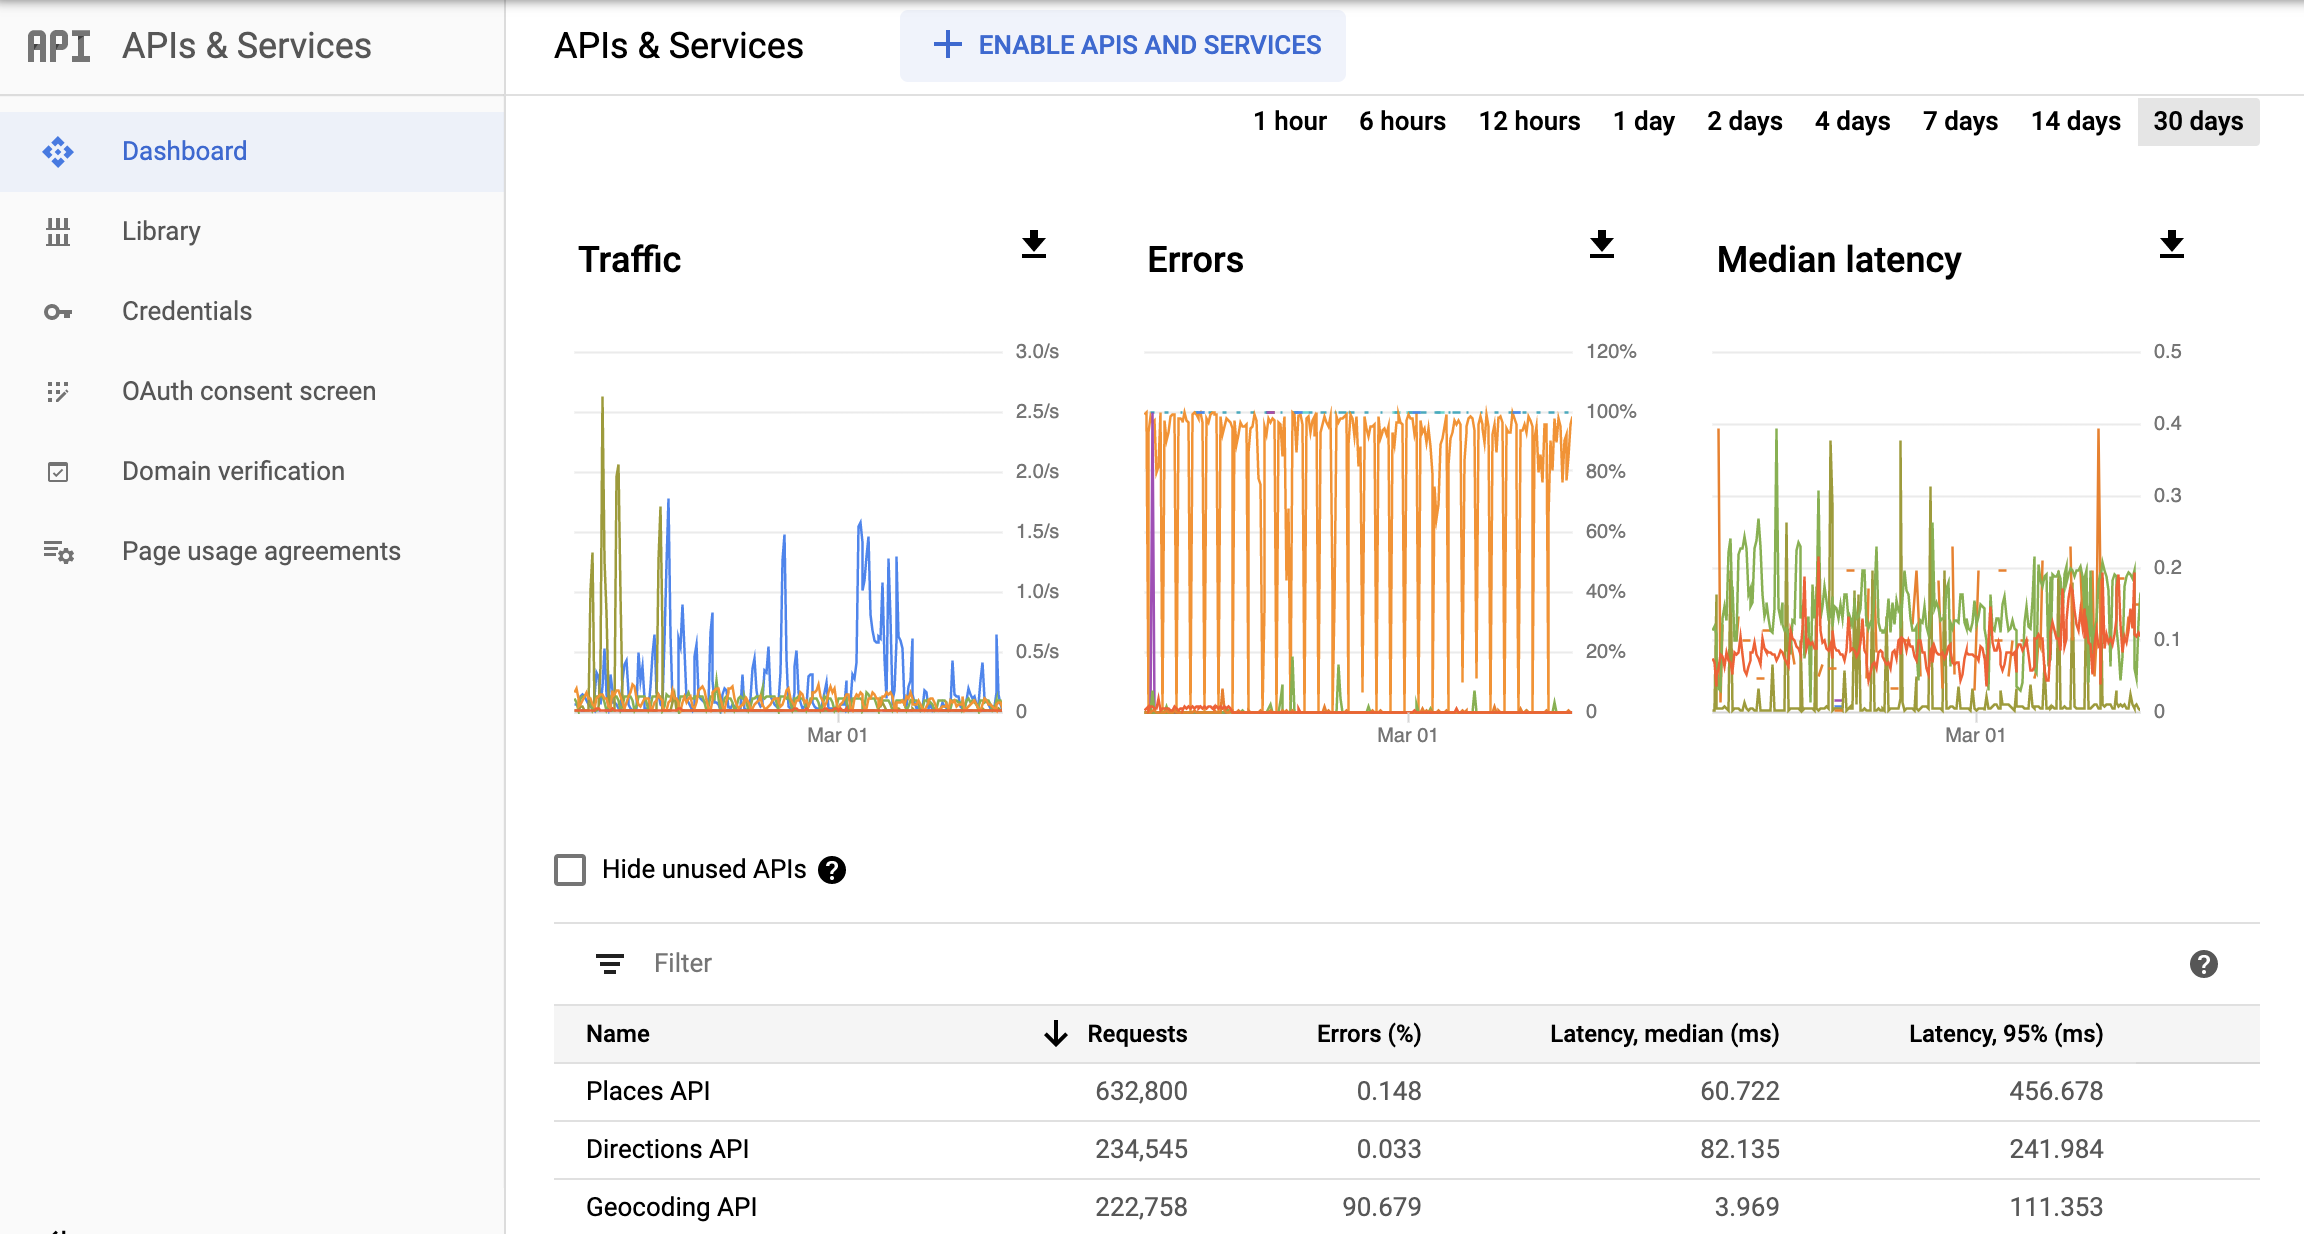
گزارش Cloud Console APIs & Services معیارهای استفاده را برای همه APIهای فعال شده برای پروژه شما، از جمله APIها و SDKهای پلتفرم Maps و همچنین سایر APIها و سرویسهای Google ارائه میکند.
این تصویر گزارش APIs & Services را نشان می دهد.

سهمیه ها
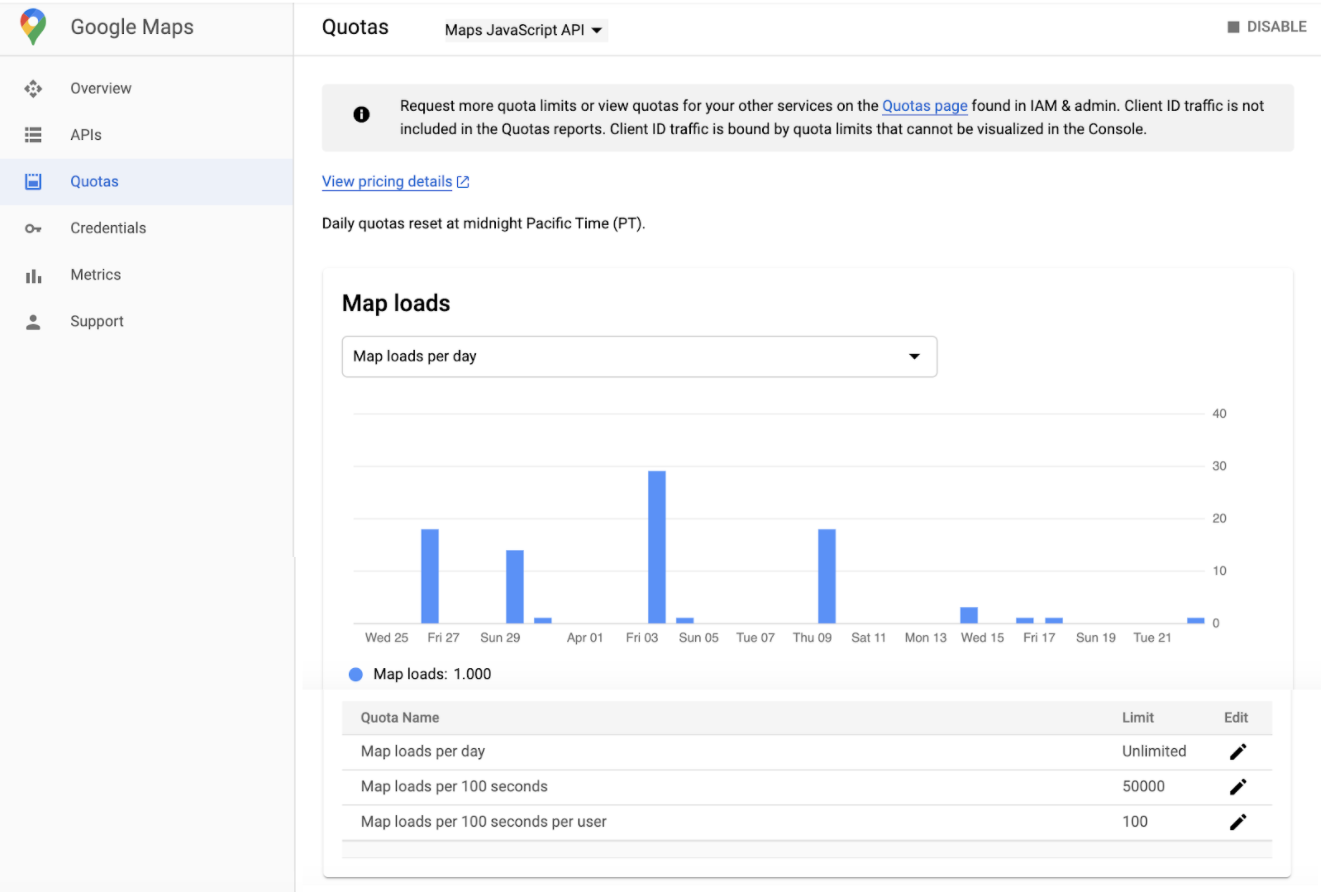
سهمیهها محدودیتهایی را برای تعداد درخواستهایی که پروژه شما میتواند به APIهای پلتفرم Maps ارائه دهد تعیین میکند. درخواست ها را می توان به سه روش محدود کرد:
- در روز
- در هر دقیقه
- هر کاربر در دقیقه (در صورت وجود)
فقط درخواستهای موفق و درخواستهایی که باعث خطای سرور میشوند در سهمیه حساب میشوند. درخواستهایی که احراز هویت ناموفق هستند در سهمیه حساب نمیشوند.
استفاده از سهمیه در نمودارهای صفحه گزارش سهمیه در کنسول Cloud نمایش داده می شود.

صورتحساب
گزارشهای صورتحساب کنسول Cloud اطلاعات صورتحساب و هزینه مربوط به پروژهای را که انتخاب کردهاید ارائه میکند.
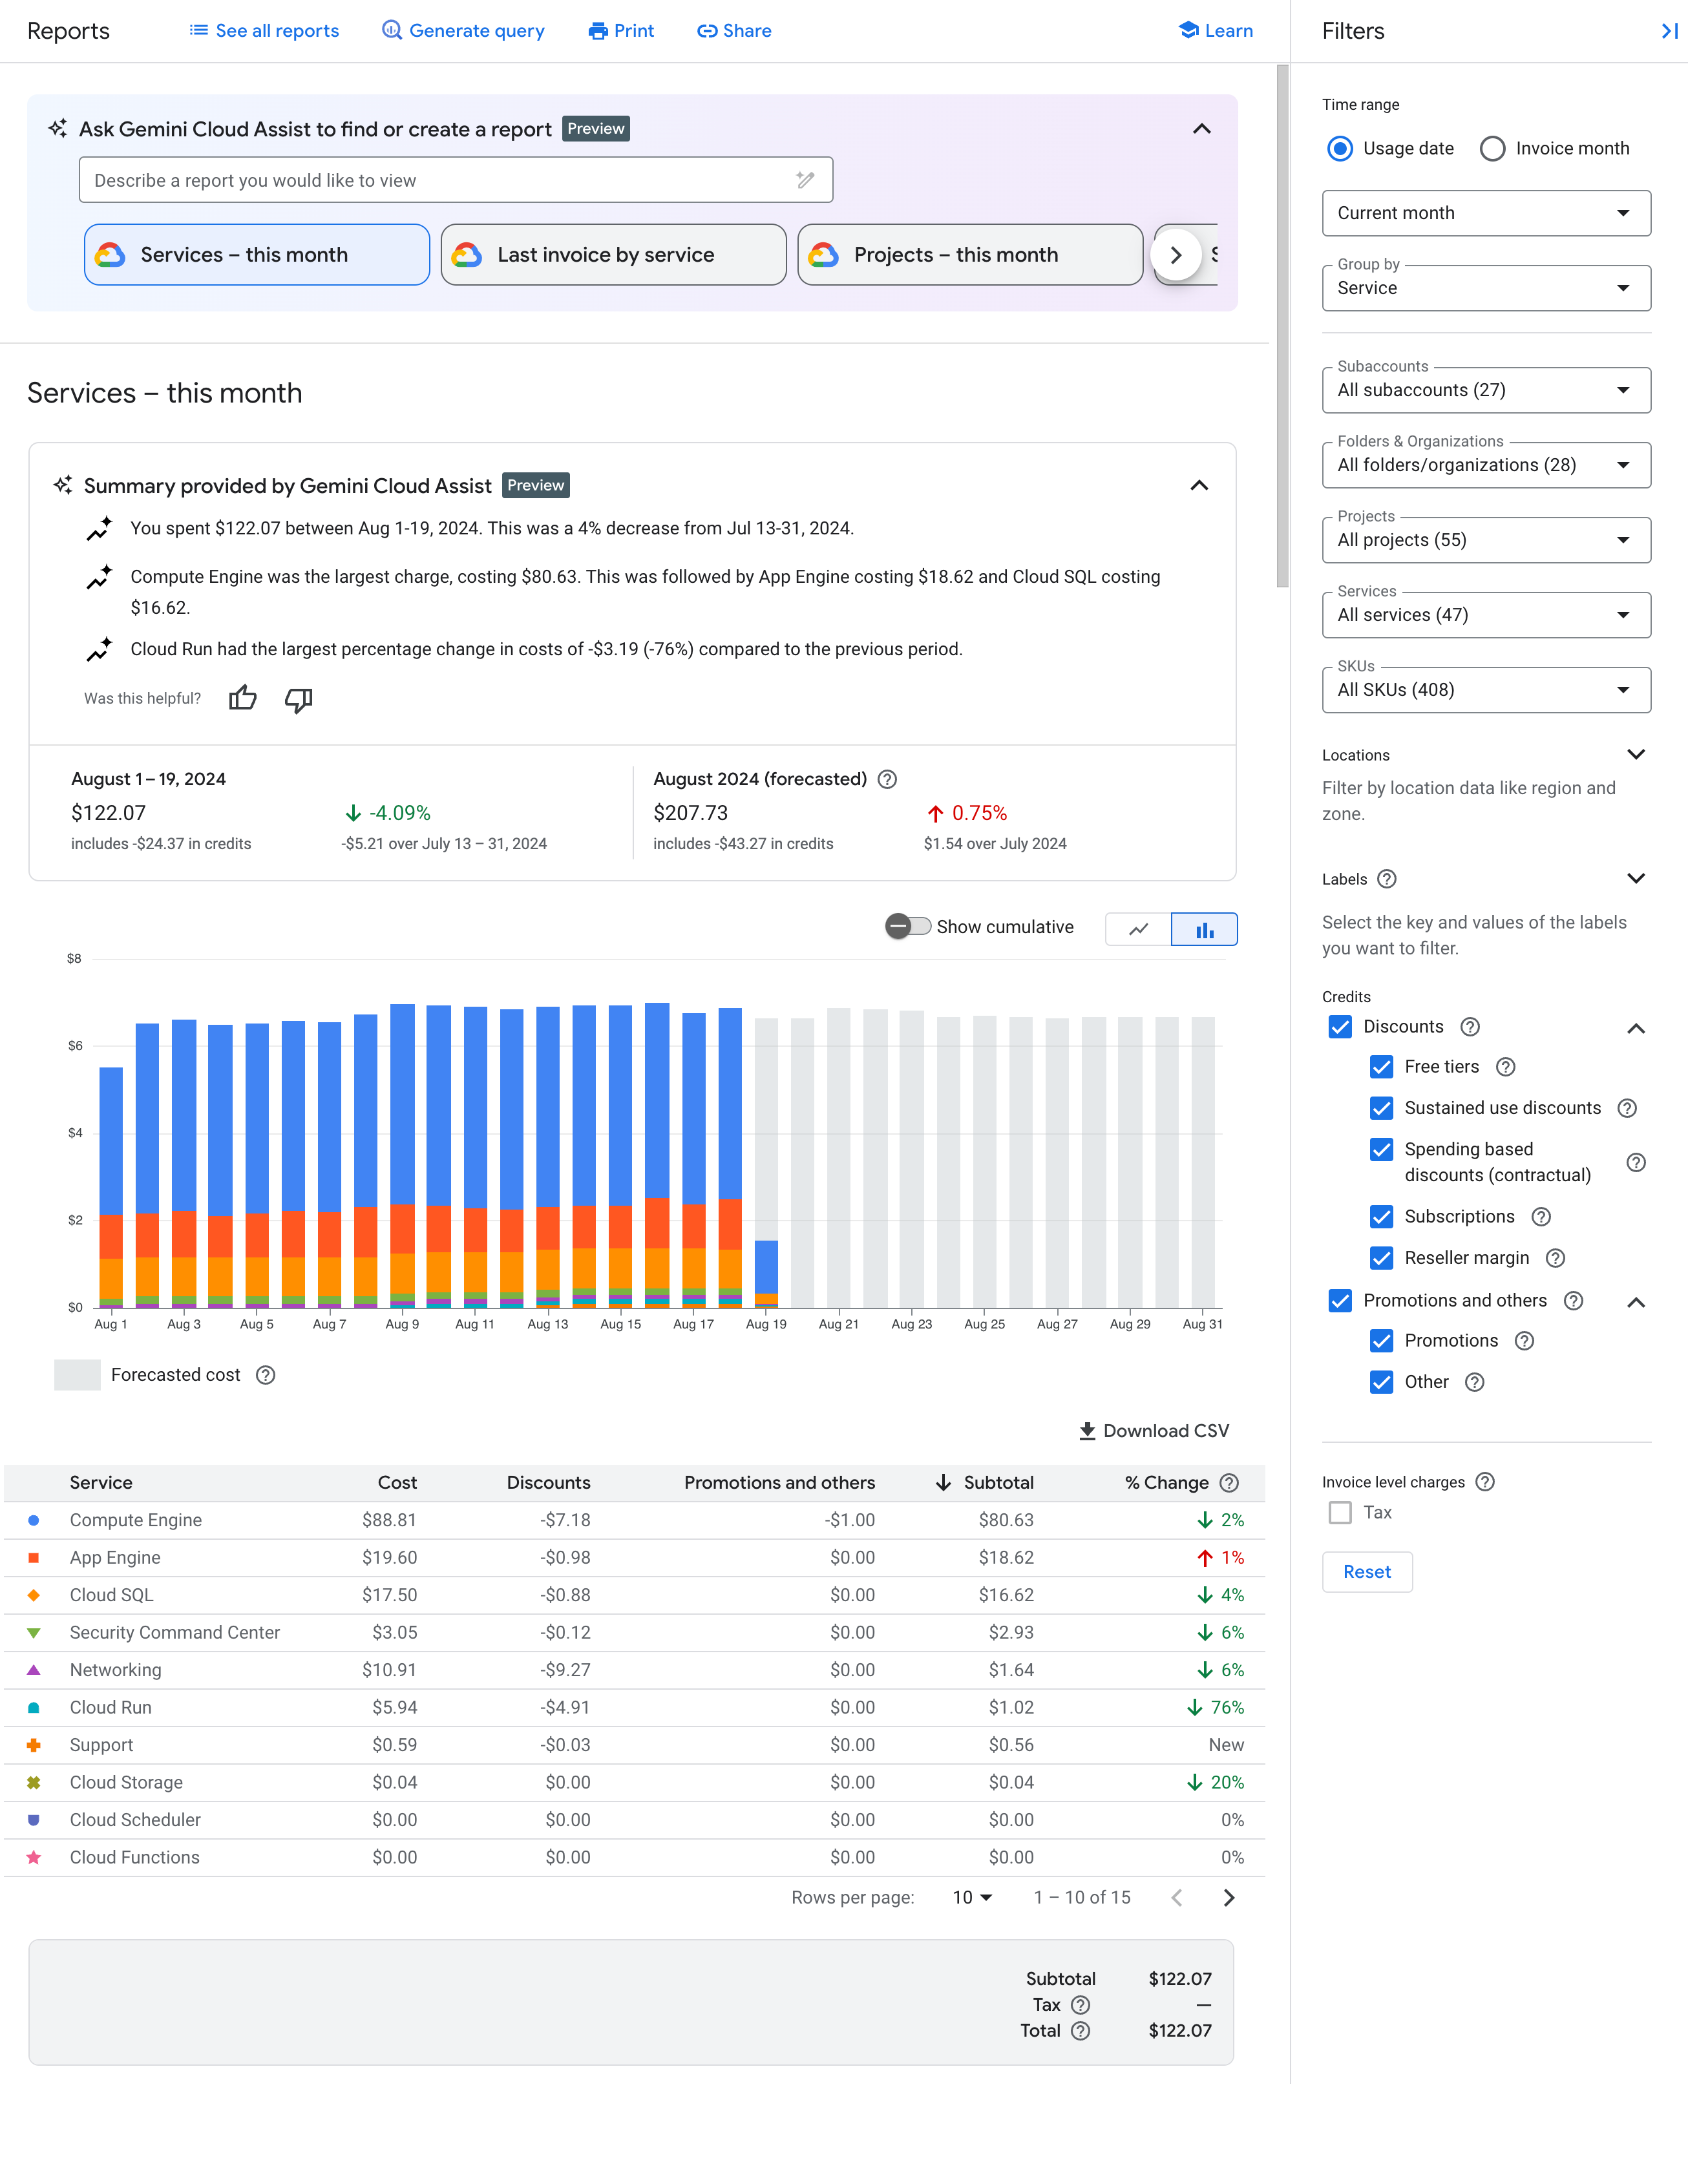
صفحه گزارشهای صورتحساب ابری به شما امکان میدهد هزینههای استفاده از Google Cloud خود را برای همه پروژههای مرتبط با حساب صورتحساب ابری مشاهده کنید. برای کمک به مشاهده روندهای هزینه ای که برای شما مهم است، می توانید یک محدوده داده را انتخاب کنید، یک محدوده زمانی را مشخص کنید، فیلترهای نمودار را پیکربندی کنید و براساس پروژه، سرویس، SKU یا مکان گروه بندی کنید.
گزارشهای صورتحساب ابری میتواند به شما کمک کند به سؤالاتی مانند این پاسخ دهید:
- روند هزینه های ماه جاری Google Cloud من چگونه است؟
- چه پروژه ای در ماه گذشته بیشترین هزینه را داشته است؟
- هزینه های آتی پیش بینی شده من بر اساس روندهای تاریخی چیست؟
- من بر اساس منطقه چقدر هزینه می کنم؟
این تصویر گزارش صورتحساب را نشان می دهد.

نظارت
Cloud Monitoring اندازهگیریهایی را از خدمات شما و منابع Google Cloud که استفاده میکنید جمعآوری میکند. برای مثال، میتوانید تماسهای API یا استفاده از سهمیه را در یک بازه زمانی مشخص نظارت کنید.
نه تنها می توانید معیارها و نمودارهای سفارشی را تعریف کنید، بلکه می توانید هشدارها را نیز تعریف کنید. هنگامی که عملکرد یک سرویس با معیارهای تعریف شده شما مطابقت ندارد، از هشدارها برای ارسال اعلان استفاده کنید. به عنوان مثال، می توانید یک اعلان به عنوان ایمیل، پیام متنی، به برنامه موبایل کنسول Cloud و گزینه های دیگر ارسال کنید.
معیارها
در مانیتورینگ ابری:
- یک متریک چیزی را توصیف می کند که اندازه گیری می شود. نمونههایی از معیارها شامل تعداد تماسها به یک API، درصد سهمیه استفاده مصرفشده یا استفاده از CPU یک ماشین مجازی است.
- سری زمانی یک ساختار داده ای است که شامل اندازه گیری های دارای مهر زمانی یک متریک و اطلاعاتی در مورد منبع و معنای آن اندازه گیری ها است.
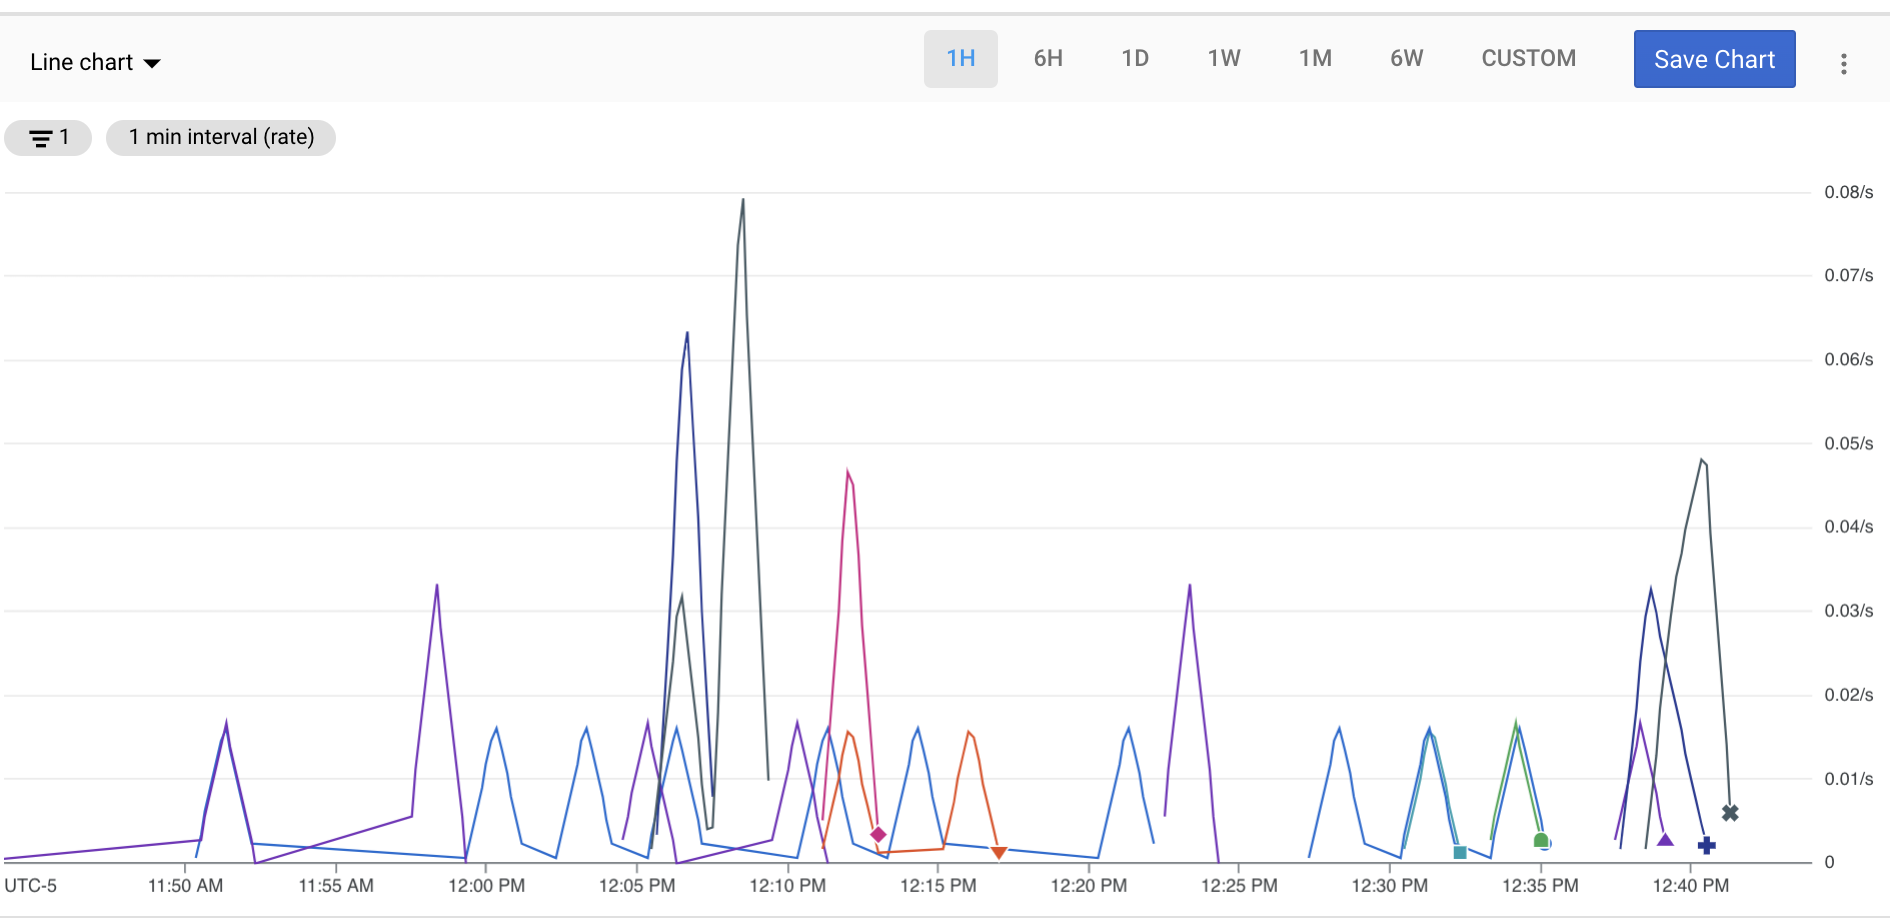
برای کاوش داده های متریک، با Metrics Explorer یک نمودار بسازید. به عنوان مثال، برای مشاهده تعداد درخواستهای یک API در فواصل یک دقیقهای در یک ساعت گذشته، از Metrics Explorer برای ساخت نموداری استفاده کنید که جدیدترین دادهها را نمایش میدهد.

داشبوردها
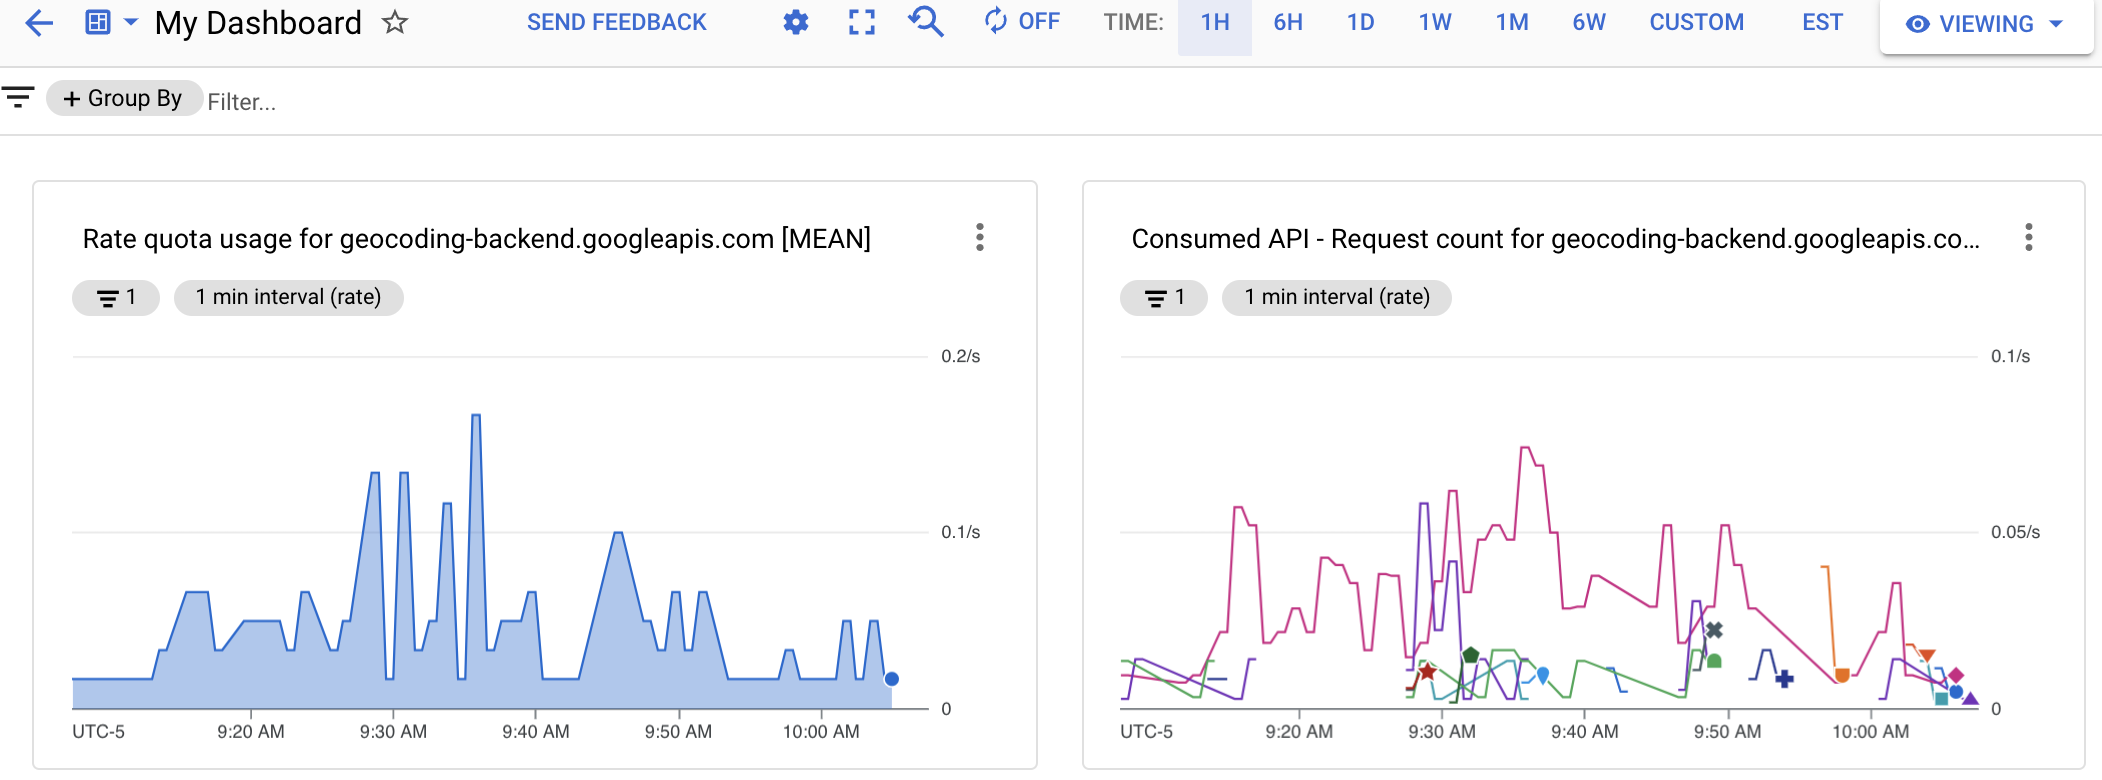
داشبوردها به شما امکان می دهند داده های سری زمانی خود را به عنوان مجموعه ای از نمودارها مشاهده و نظارت کنید. برای ایجاد داشبوردهای سفارشی، می توانید از کنسول Cloud یا Cloud Monitoring API استفاده کنید.
تصویر زیر یک داشبورد سفارشی با دو نمودار را نشان میدهد: نمودار سهمیه در سمت چپ و نمودار تعداد API در سمت راست.

هشدارها
برای اینکه وقتی عملکرد یک سرویس با معیارهای تعریف شده شما مطابقت ندارد مطلع شوید، یک خط مشی هشدار ایجاد کنید. برای مثال، میتوانید یک خطمشی هشدار ایجاد کنید که وقتی صدک ۹۰ تأخیر پاسخهای HTTP 200 از سرویس شما از 100 میلیثانیه بیشتر شود، به تیم در حال تماس شما اطلاع میدهد.
هشدار به موقع به مشکلات موجود در برنامه های ابری شما آگاهی می دهد تا بتوانید مشکلات را به سرعت حل کنید.
Cloud Monitoring از انواع مختلفی از هشدارها مانند:
- هشدارهای آستانه متریک : اگر یک متریک برای مدت زمان مشخصی از مقداری بالاتر یا کمتر شود یا یک متریک با درصد از پیش تعریف شده افزایش یا کاهش یابد، هشداری را راهاندازی میکند.
- هشدارهای بودجه : زمانی که هزینه های شما از درصدی از بودجه شما بیشتر شود، اعلان ها را راه اندازی کنید.
- هشدارهای سهمیه : هنگامی که میزان استفاده شما به حد مجاز نزدیک می شود، اعلان ها را فعال کنید.
بعدش چی
جز در مواردی که غیر از این ذکر شده باشد،محتوای این صفحه تحت مجوز Creative Commons Attribution 4.0 License است. نمونه کدها نیز دارای مجوز Apache 2.0 License است. برای اطلاع از جزئیات، به خطمشیهای سایت Google Developers مراجعه کنید. جاوا علامت تجاری ثبتشده Oracle و/یا شرکتهای وابسته به آن است.
تاریخ آخرین بهروزرسانی 2025-08-26 بهوقت ساعت هماهنگ جهانی.
[[["درک آسان","easyToUnderstand","thumb-up"],["مشکلم را برطرف کرد","solvedMyProblem","thumb-up"],["غیره","otherUp","thumb-up"]],[["اطلاعاتی که نیاز دارم وجود ندارد","missingTheInformationINeed","thumb-down"],["بیشازحد پیچیده/ مراحل بسیار زیاد","tooComplicatedTooManySteps","thumb-down"],["قدیمی","outOfDate","thumb-down"],["مشکل ترجمه","translationIssue","thumb-down"],["مشکل کد / نمونهها","samplesCodeIssue","thumb-down"],["غیره","otherDown","thumb-down"]],["تاریخ آخرین بهروزرسانی 2025-08-26 بهوقت ساعت هماهنگ جهانی."],[[["\u003cp\u003eRegularly review your Google Maps Platform API usage, quota, and billing information to control costs and identify unexpected application interactions.\u003c/p\u003e\n"],["\u003cp\u003eGoogle Maps Platform provides Reporting and Monitoring tools to help you track and manage your API usage.\u003c/p\u003e\n"],["\u003cp\u003eReporting offers predefined visual reports in the Cloud Console for basic usage, quota, and billing insights.\u003c/p\u003e\n"],["\u003cp\u003eMonitoring provides customizable dashboards and alerts for in-depth tracking and proactive notifications.\u003c/p\u003e\n"],["\u003cp\u003eUse these tools to understand your API usage patterns, stay within quota limits, and optimize your spending.\u003c/p\u003e\n"]]],["Regularly review your Google Maps Platform API usage, quota, and billing to manage costs and detect unexpected activity. Utilize two main tools: Reporting and Monitoring. Reporting offers visual reports in the Cloud console to track API calls, quota limits, and billing. Monitoring provides tools to track these metrics, create custom dashboards, and set up alerts for predefined thresholds via various notification methods, including emails and SMS. Key actions include using Cloud console to track APIs and Billing, setting quotas, and setting metric, budget, and quota alerts.\n"],null,["It's important to review your Google Maps Platform API usage, quota, and\nbilling information on a regular basis. This information helps you\nmeasure API usage, stay within predefined consumption limits, and control costs\nthrough planned budgets. Reviewing this information can also alert you to any unexpected\ninteractions that might occur between your applications and the\nGoogle Maps Platform services.\n\nThe Maps Platform provides two tools that can help you review\nusage, quota, and billing information:\n\n- [Reporting](/maps/reporting-and-monitoring/reporting): A set of predefined visual reports that let you easily see basic API usage, quota, and billing information in the Google Cloud console. You can quickly determine the number of API calls, see how close you are to hitting API usage quotas, and monitor billing usage over time.\n- [Monitoring](/maps/reporting-and-monitoring/monitoring):\n A set of tools, both in the Cloud console and through an API, that let you monitor API\n usage, quota, and billing information and define alerts when any of these\n metrics approaches a predefined limit.\n\n Monitoring lets you create your own customized\n monitoring dashboards displaying your metrics as different chart types. You can also\n issue alert notifications, such as emails or SMS text messages, when a metric\n crosses a predefined threshold.\n\nReporting\n\n[Reporting](/maps/reporting-and-monitoring/reporting)\nin the Maps Platform provides a set of predefined visual reports\nthat let you easily see basic API usage, quota, and billing information in the\nCloud console. View reports for your\nMaps Platform API usage, quota, and billing numbers by using the\n[Cloud console](https://console.cloud.google.com).\n\nAPIs \\& Services reports\n\nThe Cloud console [APIs \\& Services](https://console.cloud.google.com/project/_/apis/dashboard) report\nprovides usage metrics for all APIs enabled for your project, including the\nMaps Platform APIs and SDKs as well as all other Google APIs and\nservices.\n\nThis image shows the **APIs \\& Services** report.\n\nQuotas\n\nQuotas set limits on the number of requests your project can make to the\nMaps Platform APIs. Requests can be limited in three ways:\n\n- Per day\n- Per minute\n- Per user per minute (where available)\n\nOnly successful requests and requests\nthat cause server errors count against quota. Requests that fail authentication\ndo not count against quota.\n\nQuota usage is displayed in graphs on the **Quotas** report\npage in the Cloud console.\n\nBilling\n\nThe Cloud console [Billing](https://console.cloud.google.com/project/_/billing)\nreports provide billing and related cost information for the project you have selected.\n\nThe Cloud Billing Reports page lets you view your Google Cloud usage costs\nfor all projects linked to a Cloud Billing account. To help you view the cost\ntrends that are important to you, you can select a data range, specify a time\nrange, configure the chart filters, and group by project, service, SKU, or\nlocation.\n\nCloud Billing reports can help you answer questions like these:\n\n- How is my current month's Google Cloud spending trending?\n- What project cost the most last month?\n- What are my forecasted future costs based on historical trends?\n- How much am I spending by region?\n\nThis image shows the **Billing** report.\n\nMonitoring\n\n[Cloud Monitoring](/maps/reporting-and-monitoring/monitoring)\ncollects measurements of your service and of the Google Cloud resources\nthat you use. For example, you can monitor API calls or quota usage over a\nspecified time interval.\n\nNot only can you define custom metrics and charts, but you can also define\nalerts. Use alerts to send a notification when the performance of a service\ndoesn't meet criteria you define. For example, you can send a notification as an\nemail, text message, to the Cloud console Mobile App, and other\noptions.\n\nMetrics\n\nIn Cloud Monitoring:\n\n- A *metric* describes something that is measured. Examples of metrics include the number of calls to an API, percent of a usage quota consumed, or a virtual machine's CPU utilization.\n- A *time series* is a data structure that contains time-stamped measurements of a metric and information about the source and meaning of those measurements.\n\nTo explore metric data, build a chart with Metrics Explorer. For example,\nto view the request count of an API in one minute intervals for the past hour, use\nMetrics Explorer to construct a chart that displays the most recent data.\n\nDashboards\n\n[Dashboards](https://cloud.google.com/monitoring/dashboards) let\nyou view and monitor your time-series data as a collection of charts. To create\ncustom dashboards, you can use the Cloud console or the\nCloud Monitoring API.\n\nThe following image shows a custom dashboard with two charts:\na quota chart on the left, and an API count chart on the right.\n\nAlerts\n\nTo be notified when the performance of a service doesn't meet criteria you\ndefine, create an alerting policy. For example, you can create an alerting\npolicy that notifies your on-call team when the 90th percentile of the latency\nof HTTP 200 responses from your service exceeds 100 ms.\n\nAlerting gives timely awareness to problems in your cloud applications so you\ncan resolve the problems quickly.\n\nCloud Monitoring supports many types of alerts such as:\n\n- [Metric threshold alerts](https://cloud.google.com/monitoring/alerts/types-of-conditions#metric-threshold): Trigger an alert if a metric rises above or falls below a value for a specific duration or a metric increases or decreases by a predefined percentage.\n- [Budget alerts](https://cloud.google.com/billing/docs/how-to/budgets): Trigger notifications when your costs exceed a percentage of your budget.\n- [Quota alerts](https://cloud.google.com/monitoring/alerts/using-quota-metrics): Trigger notifications when your usage approaches a quota limit.\n\nWhat's next\n\n- [Reporting](/maps/reporting-and-monitoring/reporting)\n- [Monitoring](/maps/reporting-and-monitoring/monitoring)"]]