Fleet Engine
Fleet Engine
Fleet Engine is the backend service that you integrate into your transportation management system. It interoperates with a variety of APIs and SDKs to enhance mapping, routing, and location management, including the following Mobility SDKs:
- Driver SDK
- Consumer SDK
- Fleet operations
Driver experience

Driver experience
The Navigation SDK and Driver SDK work together to tune the driving experience to suit your delivery model.
- Navigation SDK: Create a turn-by-turn navigation experience in your app to guide drivers in real time.
- Driver SDK: Enable your driver locations and route progress to be visualized through Fleet Engine.
Consumer experience

Consumer experience
The Consumer SDK provides interfaces that model trip data and follow trip sessions in Fleet Engine, so you can deliver rich, map-based displays of trip information to your consumer users. You can make use of the following enhancements:
- Styled maps: Your maps match your branding.
- Vehicle location: Let your consumers follow the progress of their trip or delivery.
- Estimated times: Provide arrival times based on real time traffic conditions.
Fleet operations

Fleet operations
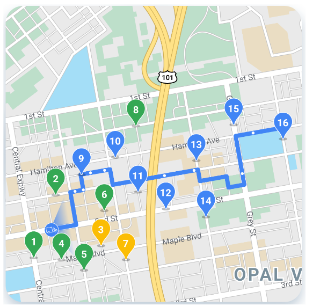
Visualize the locations of delivery vehicles and their stops in your fleets in near real time. If the route is known, the map view component animates that vehicle as it moves along its predicted path. Fleet Operations includes the following features:
- Fleet tracking: Display the real-time position, ETA, route, planned stops, and completed tasks for the vehicles in your fleet.
- Cloud logging: Get extensive logs that you can analyze and use to produce metrics and improve the performance of your fleet.
Google Maps Platform Mobility services
Mobility services is a development toolkit for building transportation and logistics operations for your business. The offering includes a variety of APIs and SDKs that you integrate into your applications for two fundamental use cases:
- On demand driver services, such as ridesharing and food delivery
- Scheduled driver services, such as deliveries
The toolkit provides web services and a set of APIs that wrap the functionality of maps, routes, and places into interfaces specifically designed for these industry use cases. It also includes a backend service to help orchestrate driver journeys, analytics, and tracking services for fleet operations teams.
Browse the information on the right to see what each mobility service provides.
Mobility service packages
Review the available packages to help you run transportation and logistics operations for your business. Read about Quotas, or to get started or for more information, contact sales.
Mobility Activate includes access to a wide range of Google Maps Platform APIs, including the Navigation SDK.
Mobility Optimize includes all of the services in the Mobility Activate package, plus APIs for speed limits and single vehicle route optimization.
Mobility Accelerate includes all of the services in Mobility Optimize plus the APIs & SDKs needed to integrate with the stateful Fleet Engine service that receives, maintains, and provides information about vehicles, trips, and tasks.