
heatmapTiles এন্ডপয়েন্টটি একটি টাইল ওভারলের মাধ্যমে বায়ুর গুণমান সম্পর্কিত হিটম্যাপ প্রদান করে। টাইল ওভারলে হলো PNG ইমেজ টাইলের একটি সংগ্রহ যা গুগল ম্যাপসের উপরে প্রদর্শন করা যায়। প্রতিটি ইমেজ টাইলের আকার হলো (২৫৬ x ২৫৬ পিক্সেল)।
হিটম্যাপ টাইলস সম্পর্কে
টাইল ওভারলে হলো একাধিক টাইল দিয়ে গঠিত একটি গ্রিড, যার প্রত্যেকটিকে ( X , Y ) স্থানাঙ্ক দেওয়া থাকে। (0,0) স্থানাঙ্কের টাইলটি সর্বদা মানচিত্রের উত্তর-পশ্চিম কোণে থাকে। X এর মান পশ্চিম থেকে পূর্ব দিকে বৃদ্ধি পায়, এবং Y এর মান উত্তর থেকে দক্ষিণ দিকে বৃদ্ধি পায়।
zoom level নির্ধারণ করে যে একটি ম্যাপ ভিউতে ম্যাপের বিষয়বস্তু কতটা বড় বা ছোট দেখাবে। টাইল গ্রিডের আকার জুম লেভেল দ্বারা X এবং Y স্থানাঙ্ককে সূচকীয়ভাবে স্কেল করার মাধ্যমে নির্ধারিত হয়।
gridSizeX = XzoomLevel
gridSizeY = YzoomLevel
উদাহরণস্বরূপ, জুম লেভেল ২-এ বিশ্ব মানচিত্রটি একটি ৪ x ৪ ম্যাট্রিক্স ব্যবহার করে উপস্থাপন করা হয়, যেখানে মোট ১৬টি টাইল থাকে। জুম আরও নির্ধারণ করে যে স্থানাঙ্কের জন্য অনুমোদিত সর্বোচ্চ মান কত হবে।
নিম্নোক্ত চিত্রটিতে জুম লেভেল ২-এর একটি US_AQI হিটম্যাপ এবং এর সাথে প্রতিটি টাইলের স্থানাঙ্ক দেখানো হয়েছে:

অতিরিক্ত বিবরণের জন্য মানচিত্র ও টাইলের স্থানাঙ্ক দেখুন।
হিটম্যাপ এন্ডপয়েন্ট সম্পর্কে
একটি হিটম্যাপ টাইল একটি বাইট অ্যারে দ্বারা উপস্থাপিত হয়, যেখানে টাইলের ডেটা একটি PNG ইমেজ হিসেবে থাকে। আপনি heatmapTiles এন্ডপয়েন্ট ব্যবহার করে বর্তমান বায়ুর মানের হিটম্যাপ টাইলগুলির জন্য অনুরোধ করতে, নিম্নলিখিত ঠিকানায় একটি HTTP GET অনুরোধ পাঠান:
https://airquality.googleapis.com/v1/mapTypes/TYPE/heatmapTiles/Z/X/Y?key=YOUR_API_KEY
একটি অনুরোধে সমস্ত অনুরোধ প্যারামিটার আবশ্যক:
TYPE- যে ধরনের হিটম্যাপ ফেরত দেওয়া হবে। অনুমোদিত মানগুলো দেখুন।Z- জুম লেভেল যা নির্ধারণ করে ম্যাপ ভিউতে একটি ম্যাপের বিষয়বস্তু কতটা বড় বা ছোট দেখাবে। অনুমোদিত মান হলো ০-১৬, যেখানে ০ মানটি পুরো বিশ্বকে একটি একক টাইলে প্রদর্শন করে।X,Y- উত্তর-পশ্চিম কোণার (0,0) সাপেক্ষে পুনরুদ্ধার করার জন্য টাইলটির স্থানাঙ্ক।Xএর মান পশ্চিম থেকে পূর্ব দিকে এবংYমান উত্তর থেকে দক্ষিণ দিকে বৃদ্ধি পায়।টাইলের স্থানাঙ্ক নির্দিষ্ট জুম লেভেলের জন্য বৈধ হতে হবে। উদাহরণস্বরূপ, যদি আপনি জুম লেভেল ২ সেট করেন এবং ১০,১০ স্থানাঙ্কে একটি টাইলের জন্য অনুরোধ করেন, তাহলে এপিআই একটি ত্রুটি দেখাবে।
YOUR_API_KEY- আপনার অ্যাপ্লিকেশনের এপিআই কী। এই কী কোটা ব্যবস্থাপনার উদ্দেশ্যে আপনার অ্যাপ্লিকেশনকে শনাক্ত করে। আরও তথ্যের জন্য, "একটি কী পান" দেখুন।
হিটম্যাপ অনুরোধের উদাহরণ
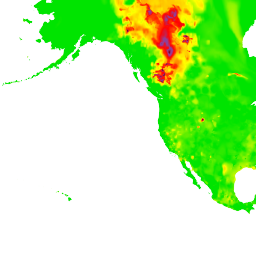
উপরের ছবিতে জুম লেভেল ২ সহ একটি US_AQI হিটম্যাপ এবং এর প্রতিটি টাইলের স্থানাঙ্ক দেখানো হয়েছে। নিচের উদাহরণটিতে হিটম্যাপ থেকে ০,১ স্থানাঙ্কের টাইলটি অনুরোধ করার জন্য heatmapTiles এন্ডপয়েন্ট ব্যবহার করা হয়েছে:
https://airquality.googleapis.com/v1/mapTypes/US_AQI/heatmapTiles/2/0/1?key=YOUR_API_KEY
টাইলটি দেখতে নিম্নরূপ:
ডিফল্ট ম্যাপের উপরে টাইলস স্থাপন করার বিষয়ে আরও তথ্যের জন্য, ওভারলে ম্যাপের প্রকারভেদ দেখুন।