
Chrome DevTools を使用して、Interactive Canvas ウェブアプリをデバッグできます。Chrome デバッガは、ソフトウェア バージョン 30 以降(このアップデートは 2020 年 10 月にリリース開始)で、キャスト ファームウェア バージョン 1.50 以降の Google Home または Google Nest スマートディスプレイでサポートされています。バージョンは、スマートディスプレイの System settings / About device で確認できます。
環境を設定する
デバッグを行う前に、以下の手順で環境を正しく設定します。
- Actions Console のシミュレータでテスト対象のアクションを有効にします。
- テスト対象の Google Home デバイスまたは Google Nest デバイスと同じローカルエリア ネットワークにマシンを接続します。
- ネットワークがデバイス間のパケットをブロックしていないことを確認します。
- Actions Console と、Google Home デバイスまたは Google Nest デバイスで、同じ Google アカウントを使ってログインします。
環境の準備が整ったら、テスト用のスマートディスプレイでアクションを起動できます。
Canvas ウェブアプリをデバッガに接続する
Canvas ウェブアプリを Chrome DevTools デバッガに接続するには、次の手順を行います。
- ローカルの開発マシンに Google Chrome ブラウザをインストールして起動します。
- Chrome ブラウザのアドレス フィールドに「
chrome://inspect#devices」と入力して、Chrome インスペクタを起動します。ページにデバイスのリストが表示され、テスト用 Google Home デバイスまたは Google Nest デバイスの名前の下に Canvas HTML URL が表示されます。Chrome がネットワーク上のすべてのデバイスを検出するまでに時間がかかることがあります。 - HTML URL の下の
inspectリンクをクリックして Chrome DevTools を起動します。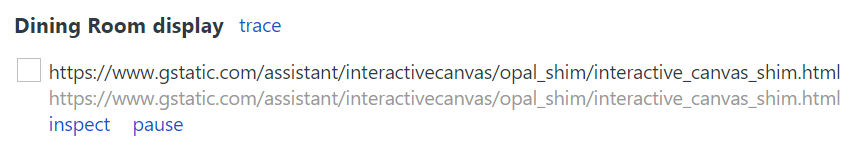
Chrome DevTools が専用のウィンドウで読み込まれます。スクリーンキャスト(![]() )ボタンをクリックすると、ウェブ GUI がデバイスにレンダリングされます。次のスクリーンショットは、Chrome DevTools でウェブアプリがどのように表示されるかを示しています。
)ボタンをクリックすると、ウェブ GUI がデバイスにレンダリングされます。次のスクリーンショットは、Chrome DevTools でウェブアプリがどのように表示されるかを示しています。
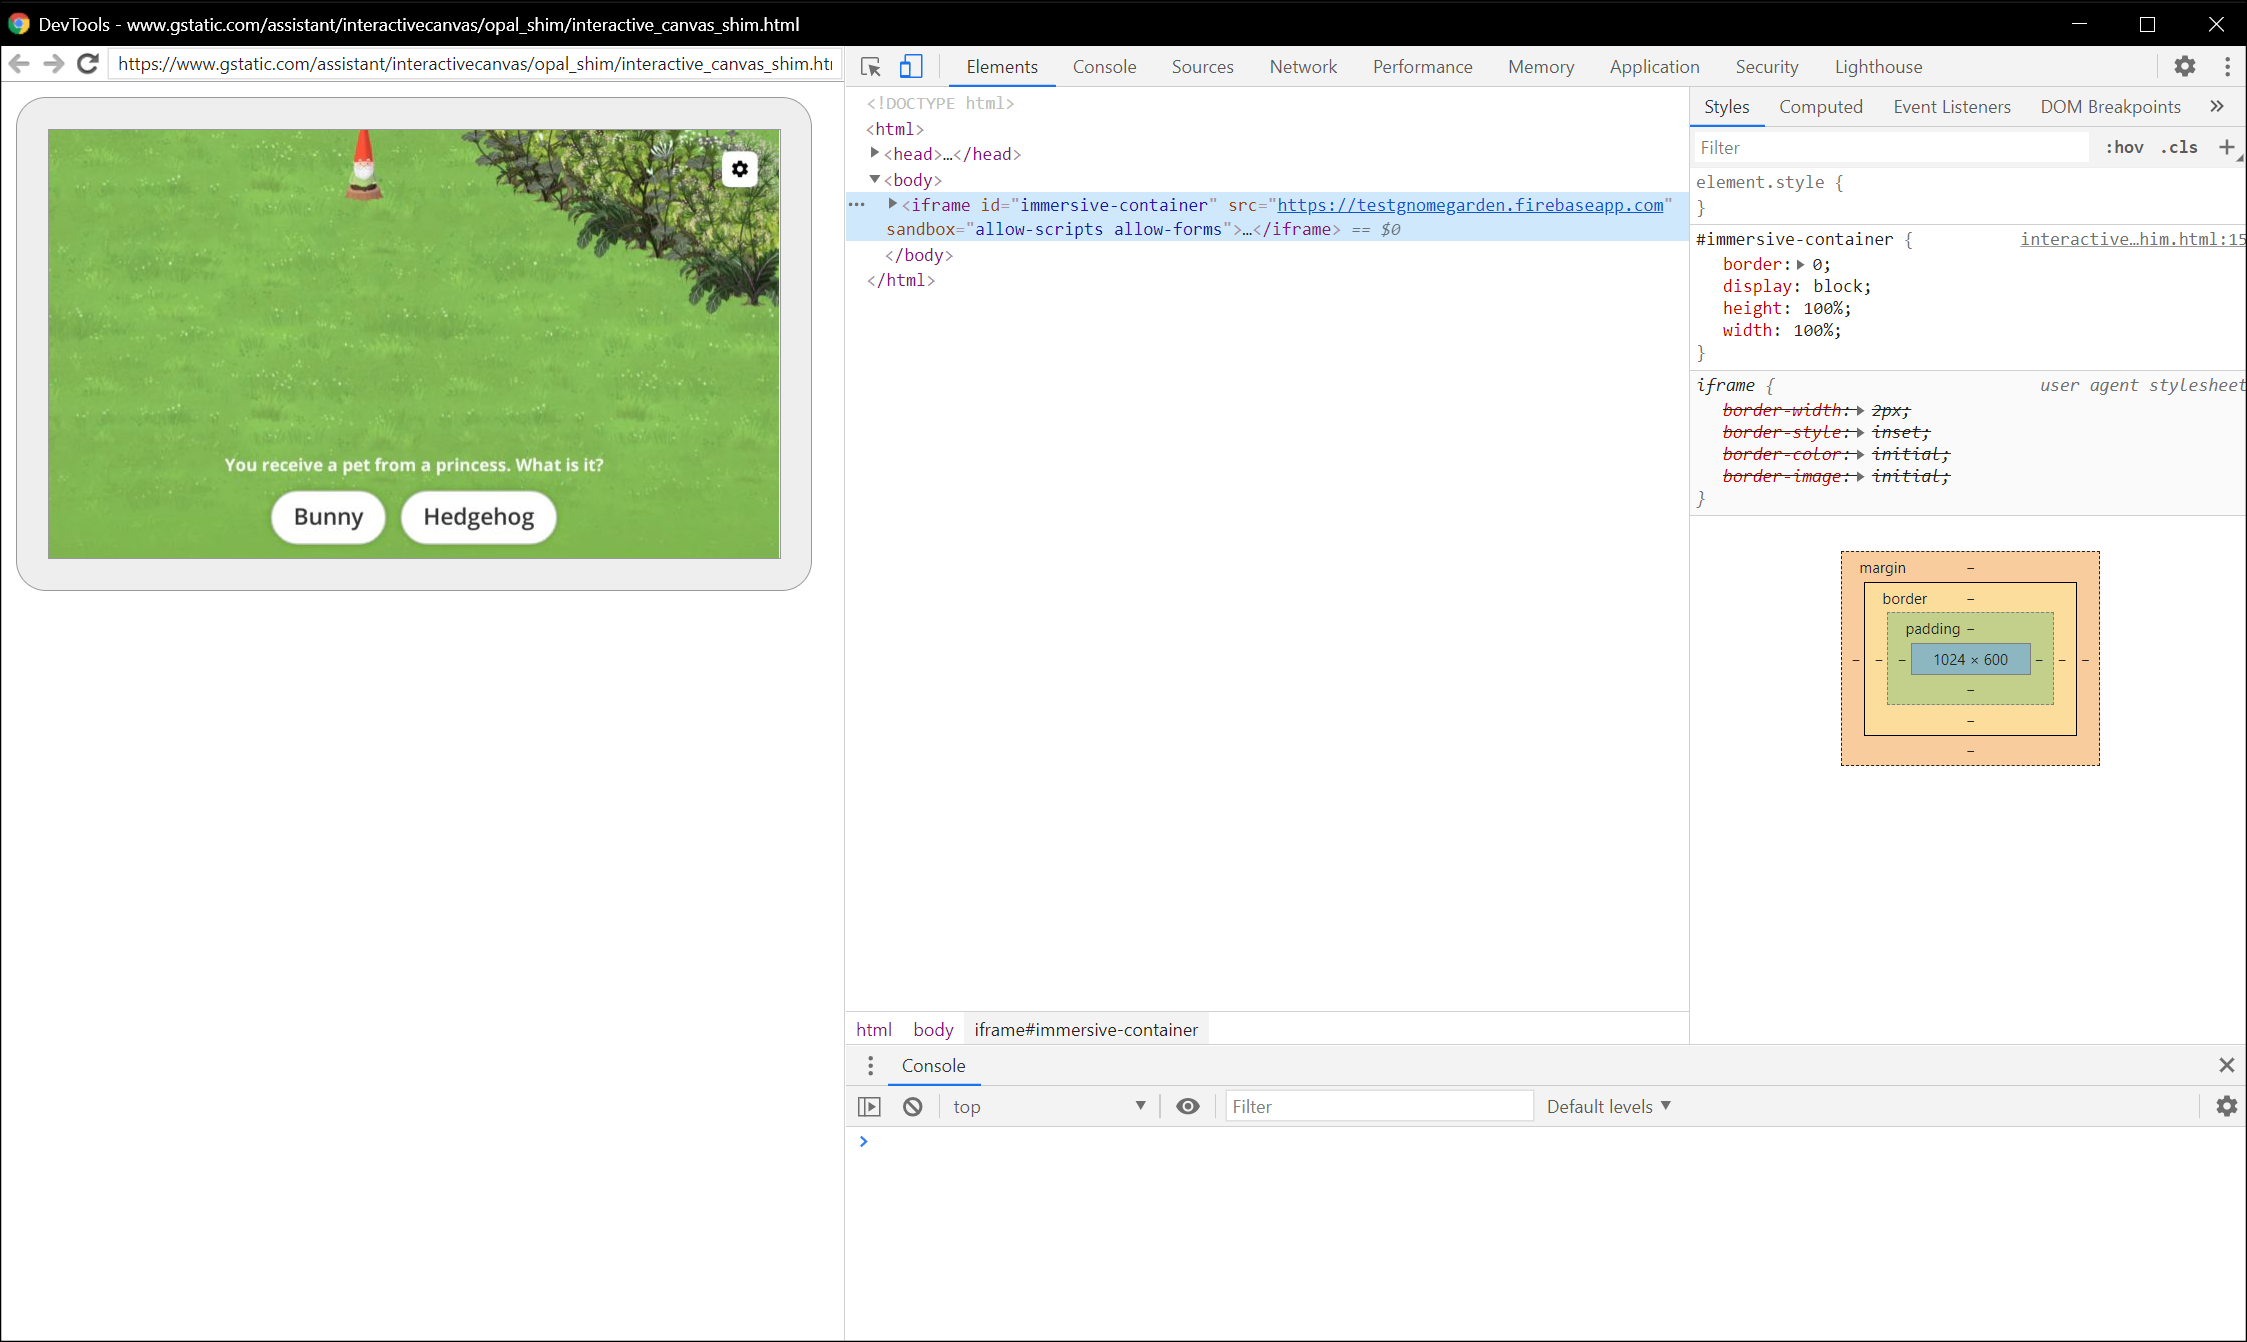
Canvas ウェブアプリは iframe 内で読み込まれます。
デバッグのヒント
デバッグ中は、次の点に注意してください。
- Chrome DevTools でページを更新し、開発用 URL にある最新のコードでローカル フルフィルメント アプリ コンテナを再読み込みします。
- JavaScript アプリがエラーなしで読み込まれていることを確認します。これを行うには、DevTools ページのコンソール セクションを確認します。
- ウェブアプリのコード内で
debugger;を使用して、コードに手動ブレークポイントを追加します。 - デバイスが長時間
chrome://inspect#devicesに表示されない場合は、検査ページを更新してください。 - パフォーマンスの問題をデバッグするには、ランタイム パフォーマンスの分析を始めるのチュートリアルをご覧ください。
- スマートディスプレイのメモリが制限されているため、200 MB を超えると、ウェブアプリがクラッシュまたはハングする可能性があります。メモリの問題をデバッグするには、メモリの問題を解決するチュートリアルをご覧ください。
- フルフィルメント エラーについては、Actions on Google サーバーから Webhook ログまたは Stackdriver ログから Webhook に送信されたリクエストを確認します。