
Once you've published a version of your Action to a release channel (alpha, beta, or production) and users have invoked your Action, you'll start seeing analytics data in the Actions console, usually within 24 hours. These analytics provide information about your Action's usage, health, discovery, and directory listing.
Usage
The Usage page displays three graphs, which pertain to the usage data of your Action. You can export data in the following graphs in CSV format.
Usage trends
This graph shows usage over time.
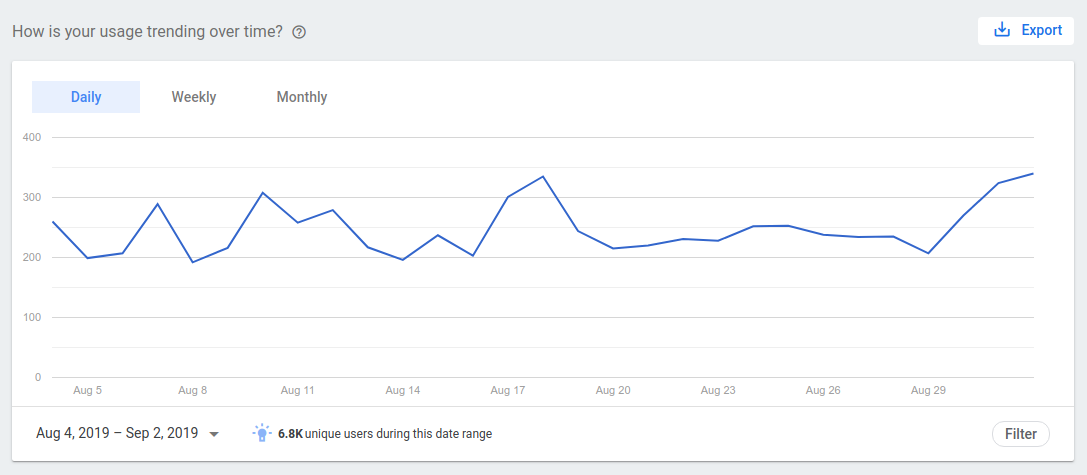
Customize the data displayed in the following ways:
Click the corresponding button at the top of the graph to see daily, weekly, and monthly usage.
Click the date range in the bottom left corner of the graph to set specific time frames to view.
- The total number of unique users for the selected date range is shown at the bottom of the chart.
Click Filter to alter the graph using the following data:
- Surface: Filter usage by surface used (for example: mobile device, smart speaker, smart display, TV, wearable, auto, feature phone, etc).
- Action: Filter usage by a specific intent.
- Language: Filter usage by specific languages your Action is available for.
- Country / Region: Filter usage by specific countries and regions your Action is available for.
You can export data from the charts in CSV format. To do so, click the Export button.
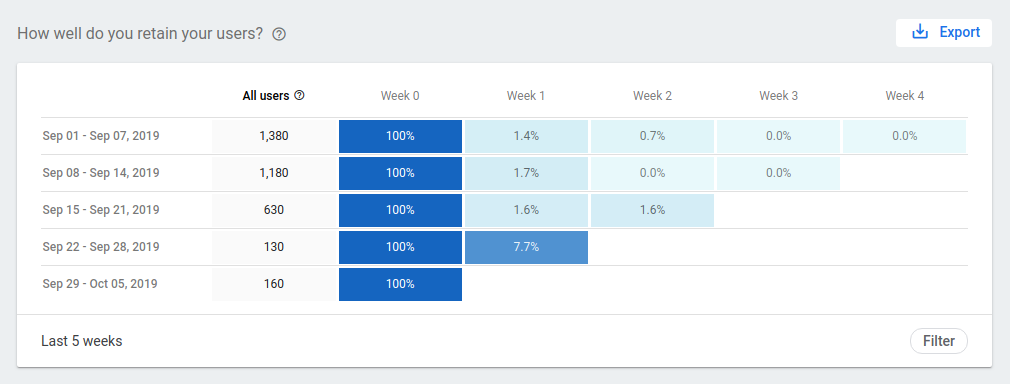
User retention
This graph shows user retention for the last five weeks. This includes all users (including new users) that have used your Action.
Customize the data displayed in the following ways:
Click Filter to alter the graph using the following data:
- Surface: Filter usage by surface used (for example: mobile device, smart speaker, smart display, TV, wearable, auto, feature phone, etc).
- Action: Filter usage by a specific intent.
- Language: Filter usage by specific languages your Action is available for.
- Country / Region: Filter usage by specific countries and regions your Action is available for.
You can export data from the charts in CSV format. To do so, click the Export button.
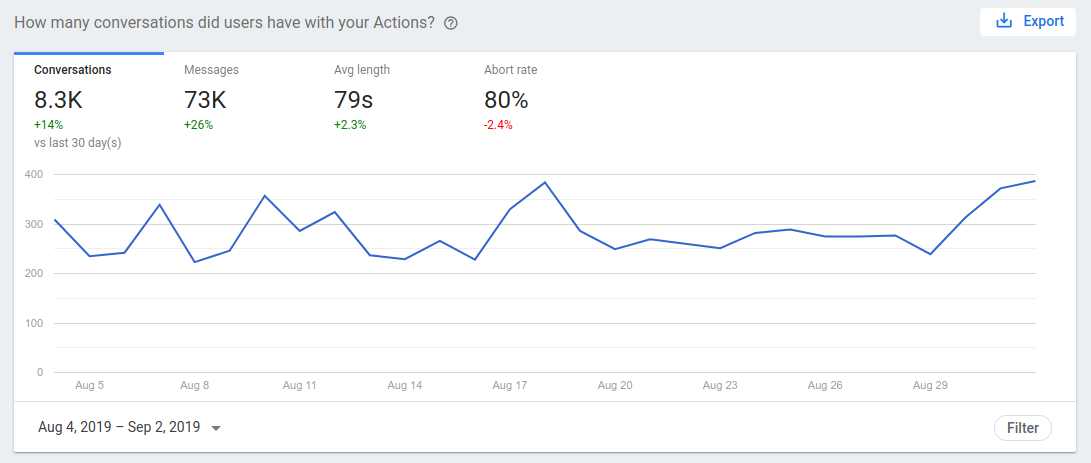
Conversation data
This graph shows conversational data related to your Action and includes the following tabs:
- Conversations: The number of conversations users had with your Action. A conversation is a single, complete interaction with your Action, starting from invocation and ending with the user exiting the context of your Action.
- Messages: The number of conversational turns across all conversations.
- Avg length: The average length, in seconds, that users engaged with your Action before exiting the conversation.
- Abort rate: The percentage of time users exited from or aborted from a conversation with your Action.
Customize the data displayed in the following ways:
- Click on the date range in the bottom left corner of the graph to set specific time frames to view.
Click Filter to alter the graph using the following data:
- Surface: Filter usage by surface used (for example: mobile device, smart speaker, smart display, TV, wearable, auto, feature phone, etc).
- Action: Filter usage by a specific intent.
- Language: Filter usage by specific languages your Action is available for.
- Country / Region: Filter usage by specific countries and regions your Action is available for.
You can export data from the charts in CSV format. To do so, click the Export button.
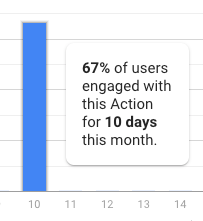
User engagement
The user engagement graph shows how your users engaged with your Action during a selected month. Commonly known as a power user curve, this graph allows you to see how many of your users are "power users", meaning dedicated users who engage with your Action regularly, by plotting the percentage of users engaging with your Action by the days in the month.
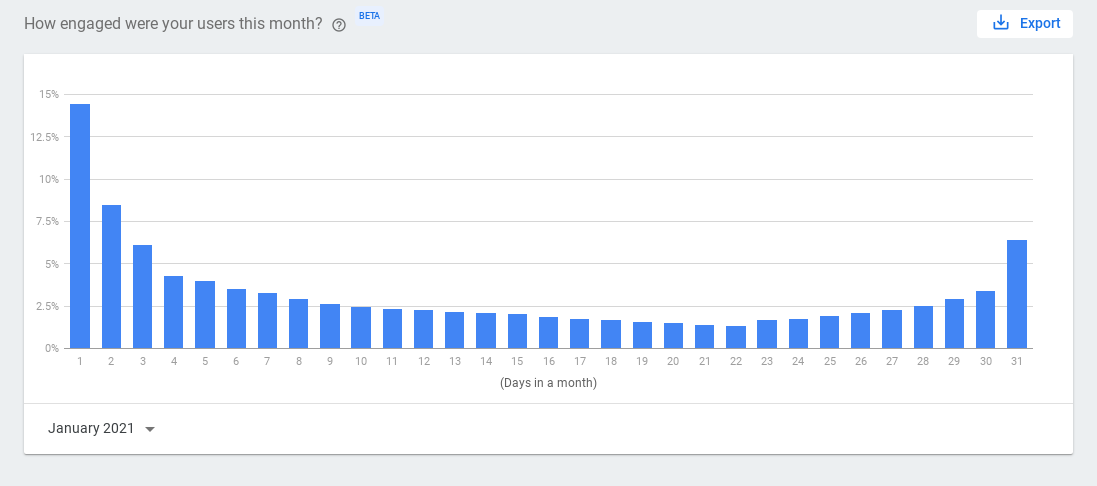
Each number on the x-axis represents the number of days in a month users engaged with your Action. For example, the 4 column represents the percentage of users that engaged with your Action 4 days in the month. If you hover your cursor over a column, a pop-up appears with this information, as shown in the following screenshot:
You can customize the data displayed in the following way:
- Click the date range in the corner of the graph to specify the month you want to see data for.
You can export data from the charts in CSV format. To export this data, click Export.
Health
The health section helps you track the following metrics related to the quality and health of your Action:
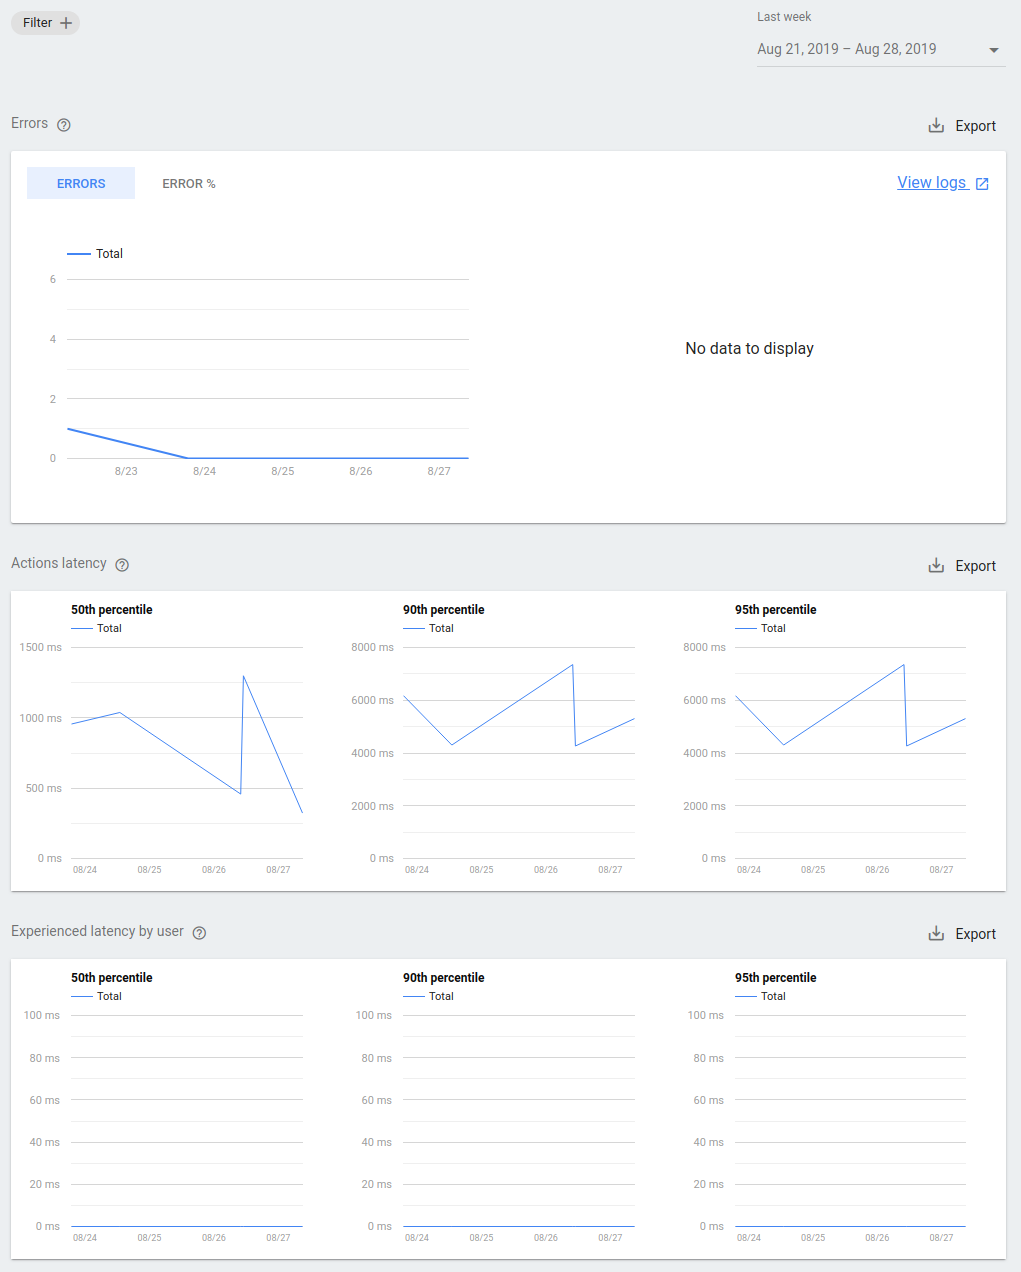
Errors: The number of errors your Action's cloud endpoint returned on a given day. If you have a large number of errors, you may want to look at your logs to identify what is causing your endpoint to crash or behave unexpectedly.
- Select the View logs link to view your project's logs in the Google Cloud console. You can learn more about reading these logs on the Troubleshooting page.
Action latency: The latency of your Action's endpoint. If latency is very high or regularly spikes, your users may be experiencing delays while interacting with your Action.
Latency experienced by user: The latency felt by a user on each request to your Action. This metric illustrates what users experience when interacting with your Action.
API Requests (Actions Builder only): This chart shows a breakdown of the total API requests and their statuses. A failed API request means the correct data was not returned.
Data can be exported from the charts, in CSV format.
Clicking on Filter gives you the following additional viewing options:
- Surface: Filter by mobile, smart speaker, and smart display devices.
- Action: Filter by specific Actions.
- Language: Filter by the languages your Action supports.
- Country/Region: Filter by country/region where your Action is available.
You can export data from the charts in CSV format. To do so, click the Export button.
Discovery
The discovery section shows information about how users are discovering your Action.
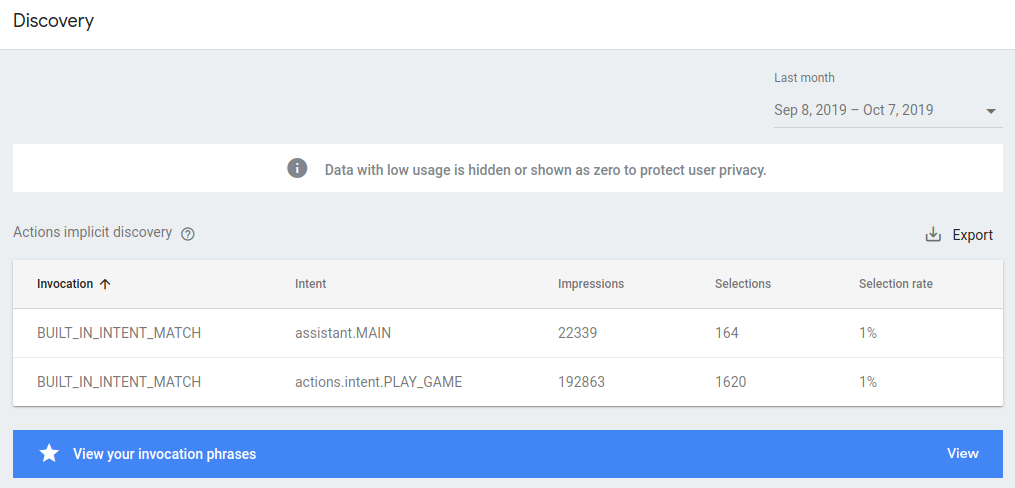
When users say a phrase related to your Action, Google will sometimes recommend that the user try your Action, even if the user did not explicitly specify your Action's invocation name. The discovery page displays a table of which phrases led to Google recommending your Action. The columns in this table are as follows:
Invocation: The user query that led to Google recommending your Action. Aside from the actual user queries, this list includes the following values:
BUILT_IN_INTENT- This listing indicates your Action was invoked through a built-in intent.AUTO_MATCHED_BY_GOOGLE- This listing indicates when implicit invocation was used.ACTION_LINK- This listing indicates when your Action was invoked through an Assistant link.
Intent: The intent the user’s query matched.
Impression: The number of times this phrase led to Google recommending your Action.
Selection: The number of times a user invoked your Action after Google recommended it. This number cannot exceed the number of impressions this phrase has.
Selection rate: The percentage of impressions that led to a selection. A low percent rate indicates that many users are opting to use other Actions for this particular query, whereas a high rate indicates that your Action is popular for this query.
You can export data from the charts in CSV format. To do so, click the Export button.
Directory
The directory section shows traffic and ratings for your Action in the Assistant directory.
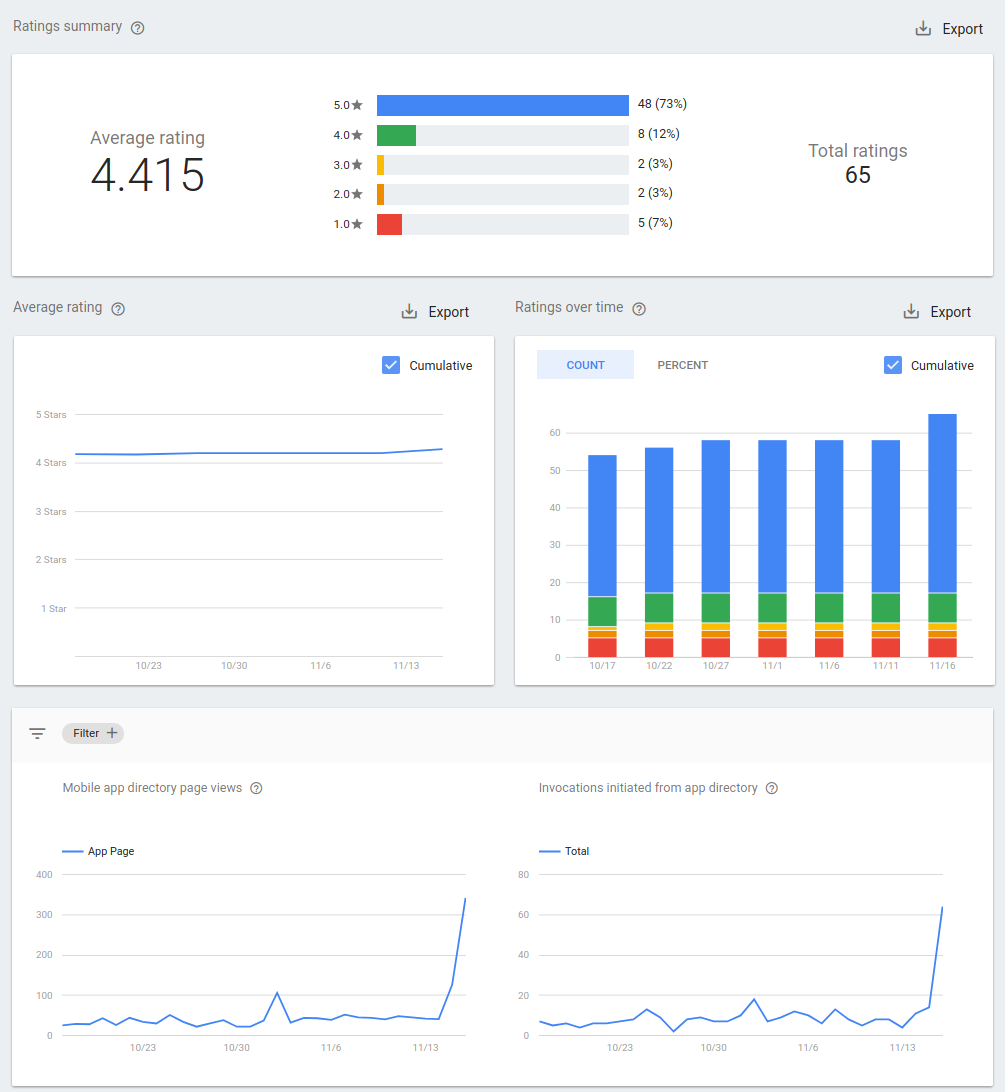
- Ratings summary: Your Action's average rating, total number of ratings, and number of users who rated your Action at each score.
- Average rating: Your Action's cumulative average rating over time, or the average of all reviews on a given day.
- Ratings over time: The distribution of your Action's cumulative rating scores over time or on a given day.
- Assistant directory page views: The number of times your Action's directory page has been visited per day. Views can be filtered by country/region, language, and other useful categorization options.
- Invocations initiated from Assistant directory: The number of times your Action has been invoked by the user pressing the "Try it" button in the directory. Invocations can be filtered by Action, country/region, and other useful categorization options.
Export to BigQuery
BigQuery is Google's fully managed, serverless data warehousing solution. You can set up your Action's analytics data to be exported daily to your BigQuery account. Once your data is in BigQuery, you can perform additional analysis on the data, including building your own dashboards and data visualization.
Connect to BigQuery
To connect your Action to BigQuery, follow these steps:
- From the Analytics page, click Export in the left menu.
- Click Get started.
Choose the date from when you want to start exporting.
Click Export.
A summary page will show the daily status of the export process as Pending, Failed, or Completed.
The export process will show as Pending until exporting is completed.
Backfill historical data
To export data from an earlier date, you can choose to backfill historical data. To do this, follow these steps:
- On the Analytics page, click Export.
- Click the gear icon.
- Click Backfill historical data.
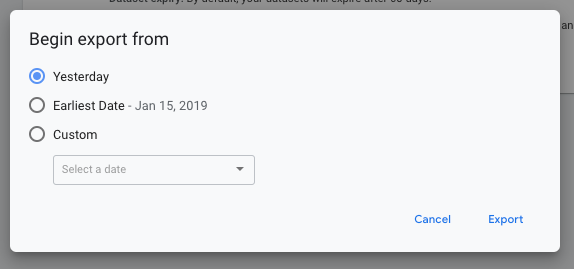
- Choose the desired date option.
- Click Export.
The backfill process will show as Pending until exporting is completed.
Stop exporting
To stop exporting to BigQuery, follow these steps:
- On the Analytics page, click Export.
- Click the gear icon.
- Click Disconnect from BigQuery.
- Click Disconnect to confirm.
Additional analytics tools
Once you've deployed your Action, you may want to track things like adoption, usage, and quality to help you analyze the current state of your Actions and answer questions like:
- How many users do I have? Are my users increasing?
- Are users confused about what to do or do they say things that my Action doesn't understand?
- Do users spend a long time with my Action, or do they regularly cancel the conversation?
- Which of my Actions are most popular, and which have low engagement?
This data helps you identify opportunities to improve the long term success of your actions. To let you obtain this data, we've let analytics tools providers integrate with Actions on Google, and you can set up these tools in as little as five minutes:
|
|
|
|
Additional monitoring tools
As you develop and deploy your Actions, you might benefit from adding logging, monitoring, and alerting. Monitoring and alerting tools track uptime and notify you of errors and exceptions. With these tools, you can also debug and test Actions with real requests from the Assistant. The following monitoring tools have integrated with Actions on Google:
|
|