
Page Summary
-
The Google Analytics Data API v1 can generate pivot tables, a data summarization tool for visualizing data by rearranging it on one or multiple dimensions.
-
Pivot report requests share features like pagination and dimension filters with Core report requests but this guide focuses on pivot-specific features.
-
The Data API v1 supports pivot functionality through the
runPivotReportandbatchRunPivotReportsmethods. -
To construct a pivot table request, you should include date ranges, dimensions, metrics, and at least two pivot entries.
-
Pivot reports return a header and rows, where each row represents a single cell of the table, unlike standard reports where each row represents a complete line.
The Google Analytics Data API v1 lets you generate pivot tables. Pivot tables are a data summarization tool that visualize data by rearranging the information in the table by pivoting (rotating) your data on one or multiple dimensions.
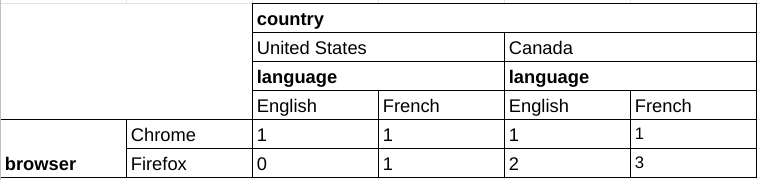
As an example, consider the following raw data table:
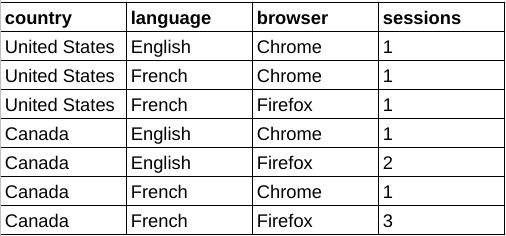
Using this data it is possible to construct a pivot table, breaking down the sessions data by browser, with country and language dimensions selected as additional pivots.
Shared Features with Core Reports
Pivot reporting requests have the same semantics with Core report requests for many shared features. For example pagination, Dimension Filters and User Properties, behave the same in Pivot Reports as Core Reports. This guide focuses on pivot reporting features. To familarize yourself with the Core Reporting functionality of the Data API v1, read the reporting basics guide, as well as advanced use cases guide.
Pivot reporting methods
The Data API v1 supports pivot functionality in the following reporting methods:
runPivotReport This method returns a customized pivot report of your Google Analytics event data. Each pivot describes the visible dimension columns and rows in the report response.
batchRunPivotReports This is a batch version of the
runPivotReportmethod which allows generating multiple reports using a single API call.
Select a Reporting Entity
All methods of the Data API v1 require the
Google Analytics property identifier to be specified inside a
URL request path in the form of properties/GA_PROPERTY_ID, such as:
POST https://analyticsdata.googleapis.com/v1beta/properties/GA_PROPERTY_ID:runPivotReport
The resulting report will be generated based on the Google Analytics event data collected in the specified Google Analytics property.
If you are using one of the Data API client libraries, there
is no need to manipulate the request URL path manually. Most API clients
provide a property parameter that expects a string in the form of
properties/GA_PROPERTY_ID. See Quick start guide
for examples of using the client libraries.
Pivot Report Request
To construct a request with a pivot table, use either the runPivotReport or the batchRunPivotReports method.
To request pivoted data, you can construct a RunPivotReportRequest object. We recommend starting with these request parameters:
- A valid entry in the dateRanges field.
- At least one valid entry in the dimensions field.
- At least one valid entry in the metrics field.
- At least two valid pivot entries in the pivots field.
Here is a sample request with the recommended fields:
HTTP
POST https://analyticsdata.googleapis.com/v1beta/properties/GA_PROPERTY_ID:runPivotReport
  {
    "dateRanges": [{ "startDate": "2020-09-01", "endDate": "2020-09-15" }],
    "dimensions": [
        { "name": "browser" },
        { "name": "country" },
        { "name": "language" }
      ],
    "metrics": [{ "name": "sessions" }],
    "pivots": [
      {
        "fieldNames": [
          "browser"
        ],
        "limit": 5
      },
      {
        "fieldNames": [
          "country"
        ],
        "limit": 250
      },
      {
        "fieldNames": [
          "language"
        ],
        "limit": 15
      }
    ]
  }
Pivots
Use Pivot objects in the pivot field of the request
body to define report pivots. Each Pivot describes the visible dimension
columns and rows in the report response.
The Data API v1 supports multiple pivots as long as the product of the limit parameter for each pivot does not exceed 100,000.
The following snippet demonstrates the usage of pivots to build
a report of session counts by country, pivoted by the browser dimension. Note
how the query uses the orderBys field
for sorting, and the limit
and offset fields to implement
pagination.
    "pivots": [
      {
        "fieldNames": [
          "country"
        ],
        "limit": 250,
        "orderBys": [
          {
            "dimension": {
              "dimensionName": "country"
            }
          }
        ]
      },
      {
        "fieldNames": [
          "browser"
        ],
        "offset": 3,
        "limit": 3,
        "orderBys": [
          {
            "metric": {
              "metricName": "sessions"
            },
            "desc": true
          }
        ]
      }
    ],
    ...
Dimensions
Dimensions describe and group event data for your
website or app. The city dimension, for example, indicates the city ("Paris"
or "New York") from which each event originated. In a report request, you can
specify zero or more dimensions.
Dimensions must be defined inside the
dimensions
field of a request body. To be visible in a report, those dimensions must also
be listed in the fieldNames
field of a Pivot object.
A dimension won't be visible in a report if it is not used in any
pivot of a pivot query. Not every dimension must be present in a pivot's
fieldNames. Dimensions can be used exclusively in filters and not in the
fieldNames of any pivot.
The following snippet demonstrates the usage of dimension and
fieldNames fields for a table with browser, country and language pivots:
    "pivots": [
      {
        "fieldNames": [
          "browser"
        ],
        "limit": 5,
        "orderBys": [
          {
            "metric": {
              "metricName": "sessions"
            },
            "desc": true
          }
        ]
      },
      {
        "fieldNames": [
          "country"
        ],
        "limit": 250,
        "orderBys": [
          {
            "dimension": {
              "dimensionName": "country"
            }
          }
        ]
      },
      {
        "fieldNames": [
          "language"
        ],
        "limit": 10
      }
    ],
Metrics
Metrics are quantitative measurements of event data for your website or app. In a report request, you can specify one or more metrics. See the API Metrics for a full list of API Metric names available to be specified in requests.
In pivot report requests, metrics are defined using the metrics field of the
request body, which is similar to Core Reporting methods.
The following example specifies sessions count to be used as a metric value in a report:
    "metrics": [
      {
        "name": "sessions"
      }
    ],
Metric aggregations
Use the metricAggregations field of a Pivot object to calculate aggregated metric values for each pivot.
Aggregations will only be calculated if the metricAggregations field is specified in a request.
The following example is a snippet of a query that requests the totals for the
browser pivot dimension:
"pivots": [
  {
    "fieldNames": [
      "browser"
    ],
    "limit": 10,
    "metricAggregations": [
      "TOTAL",
    ]
  },
  ...
The calculated metrics are returned in the aggregates
field of the RunPivotReportResponse
object. For aggregated metric rows, the dimensionValues field
contains a special value of RESERVED_TOTAL, RESERVED_MAX or RESERVED_MIN.
  "aggregates": [
    {
      "dimensionValues": [
        {
          "value": "Chrome"
        },
        {
          "value": "RESERVED_TOTAL"
        },
        {
          "value": "RESERVED_TOTAL"
        }
      ],
      "metricValues": [
        {
          "value": "4"
        }
      ]
    },
    {
      "dimensionValues": [
        {
          "value": "Firefox"
        },
        {
          "value": "RESERVED_TOTAL"
        },
        {
          "value": "RESERVED_TOTAL"
        }
      ],
      "metricValues": [
        {
          "value": "6"
        }
      ]
    },
  ....

  }
Pagination
Similar to Core Reporting methods, pivot requests allow you
to specify the limit
and offset fields in the
Pivot object to implement pagination.
Pagination settings are applied to each pivot individually.
The limit field is required for every Pivot object in order to limit the
report cardinality.
The Data API v1 supports multiple pivots as long as the product of the limit
parameter for each pivot does not exceed 100,000.
The following snippet demonstrates the usage of offset and limit fields to
retrieve the next five language dimensions with an offset of 10:
      {
        "fieldNames": [
          "language"
        ],
        "offset": 10,
        "limit": 5
      }
Filtering
Similar to the Core Reporting functionality, a request scoped dimension filter must be used if you want dimensions filtering in a pivot reporting request.
Sorting
Ordering behavior of pivot report queries can be controlled for each pivot individually using the orderBys field of a Pivot object, which contains a list of OrderBy objects.
Every OrderBy can contain one of the following:
- DimensionOrderBy, sorts results by a dimension's values.
- MetricOrderBy, sorts results by a metric's values.
- PivotOrderBy, used in pivot queries and sorts results by a metric's values within a pivot column group.
This example shows a snippet for a pivot definition that pivots the report on
the browser dimension, ordering results by the sessions metric in
descending order.
      {
        "fieldNames": [
          "browser"
        ],
        "limit": 5,
        "orderBys": [
          {
            "metric": {
              "metricName": "sessions"
            },
            "desc": true
          }
        ]
      }
Report Response
The Pivot Report Response of a pivot report API request is primarily a header and rows.
Response Headers
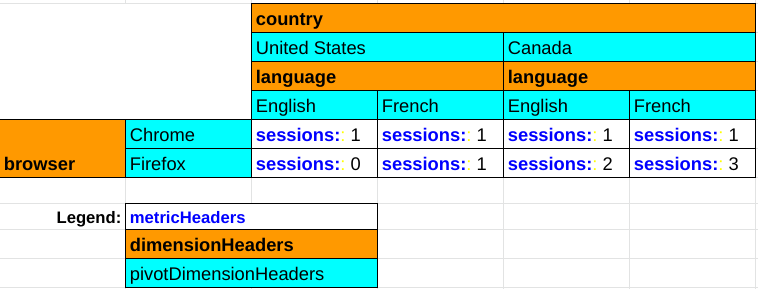
The pivot report header consists of PivotHeaders, DimensionHeaders and MetricHeaders which list the columns in the pivot report.
For example, a report with browser, country, and language pivot dimensions
and the sessions metric will yield headers like this:
{
  "pivotHeaders": [
    {
      "pivotDimensionHeaders": [
        {
          "dimensionValues": [
            {
              "value": "Chrome"
            }
          ]
        },
        {
          "dimensionValues": [
            {
              "value": "Firefox"
            }
          ]
        },
        ...

      ],
      ...
    },
    {
      "pivotDimensionHeaders": [
        {
          "dimensionValues": [
            {
              "value": "United States"
            }
          ]
        },
        {
          "dimensionValues": [
            {
              "value": "Canada"
            }
          ]
        },
        ...

      ],
      ...
    },
    {
      "pivotDimensionHeaders": [
        {
          "dimensionValues": [
            {
              "value": "English"
            }
          ]
        },
        {
          "dimensionValues": [
            {
              "value": "French"
            }
          ]
        },
        ...

      ],
      ...
    }
  ],
  "dimensionHeaders": [
    {
      "name": "browser"
    },
    {
      "name": "country"
    },
    {
      "name": "language"
    }
  ],
  "metricHeaders": [
    {
      "name": "sessions",
      "type": "TYPE_INTEGER"
    }
  ],
  ...

}
The following chart illustrates the role of each component of the Pivot Report Response in rendering the pivot report:
Response Rows
The pivot report response of runPivotReport and batchRunPivotReports methods differs from a response for Core Reporting methods like runReport and batchRunReports in that each pivot report response row represents a single cell of the table, whereas in a regular report a single response row represents a complete table line.
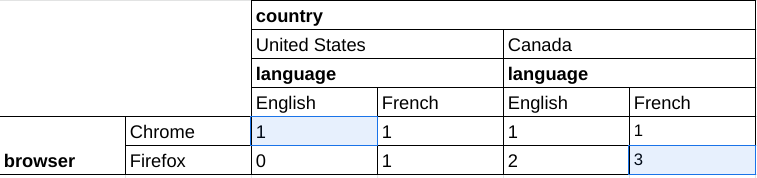
The following example shows a fragment of a pivot report response for a
query with the browser, country, and language pivot dimensions and the
sessions metric. Each cell of the pivot report is returned individually:
  "rows": [
    {
      "dimensionValues": [
        {
          "value": "Chrome"
        },
        {
          "value": "United States"
        },
        {
          "value": "English"
        }
      ],
      "metricValues": [
        {
          "value": "1"
        }
      ]
    },
    {
      "dimensionValues": [
        {
          "value": "Firefox"
        },
        {
          "value": "Canada"
        },
        {
          "value": "French"
        }
      ],
      "metricValues": [
        {
          "value": "3"
        }
      ]
    },
    ...

  ]
This data corresponds to the two cells highlighted in the following table:
Client libraries
See the Quick start guide for an explanation of how to install and configure client libraries.
The following examples use the client library to run a pivot query to build a report of session counts by country, pivoted by the browser dimension.
PHP
use Google\Analytics\Data\V1beta\Client\BetaAnalyticsDataClient; use Google\Analytics\Data\V1beta\DateRange; use Google\Analytics\Data\V1beta\Dimension; use Google\Analytics\Data\V1beta\Metric; use Google\Analytics\Data\V1beta\OrderBy; use Google\Analytics\Data\V1beta\OrderBy\DimensionOrderBy; use Google\Analytics\Data\V1beta\OrderBy\MetricOrderBy; use Google\Analytics\Data\V1beta\Pivot; use Google\Analytics\Data\V1beta\RunPivotReportRequest; use Google\Analytics\Data\V1beta\RunPivotReportResponse; /** * Runs a pivot query to build a report of session counts by country, * pivoted by the browser dimension. * @param string $propertyId Your GA-4 Property ID */ function run_pivot_report(string $propertyId) { // Create an instance of the Google Analytics Data API client library. $client = new BetaAnalyticsDataClient(); // Make an API call. $request = (new RunPivotReportRequest()) ->setProperty('properties/' . $propertyId) ->setDateRanges([new DateRange([ 'start_date' => '2021-01-01', 'end_date' => '2021-01-30', ]), ]) ->setPivots([ new Pivot([ 'field_names' => ['country'], 'limit' => 250, 'order_bys' => [new OrderBy([ 'dimension' => new DimensionOrderBy([ 'dimension_name' => 'country', ]), ])], ]), new Pivot([ 'field_names' => ['browser'], 'offset' => 3, 'limit' => 3, 'order_bys' => [new OrderBy([ 'metric' => new MetricOrderBy([ 'metric_name' => 'sessions', ]), 'desc' => true, ])], ]), ]) ->setMetrics([new Metric(['name' => 'sessions'])]) ->setDimensions([ new Dimension(['name' => 'country']), new Dimension(['name' => 'browser']), ]); $response = $client->runPivotReport($request); printPivotReportResponse($response); } /** * Print results of a runPivotReport call. * @param RunPivotReportResponse $response */ function printPivotReportResponse(RunPivotReportResponse $response) { print 'Report result: ' . PHP_EOL; foreach ($response->getRows() as $row) { printf( '%s %s' . PHP_EOL, $row->getDimensionValues()[0]->getValue(), $row->getMetricValues()[0]->getValue() ); } }
Python
from google.analytics.data_v1beta import BetaAnalyticsDataClient from google.analytics.data_v1beta.types import ( DateRange, Dimension, Metric, OrderBy, Pivot, RunPivotReportRequest, ) def run_sample(): """Runs the sample.""" # TODO(developer): Replace this variable with your Google Analytics 4 # property ID before running the sample. property_id = "YOUR-GA4-PROPERTY-ID" run_pivot_report(property_id) def run_pivot_report(property_id="YOUR-GA4-PROPERTY-ID"): """Runs a pivot query to build a report of session counts by country, pivoted by the browser dimension.""" client = BetaAnalyticsDataClient() request = RunPivotReportRequest( property=f"properties/{property_id}", date_ranges=[DateRange(start_date="2021-01-01", end_date="2021-01-30")], pivots=[ Pivot( field_names=["country"], limit=250, order_bys=[ OrderBy( dimension=OrderBy.DimensionOrderBy(dimension_name="country") ) ], ), Pivot( field_names=["browser"], offset=3, limit=3, order_bys=[ OrderBy( metric=OrderBy.MetricOrderBy(metric_name="sessions"), desc=True ) ], ), ], metrics=[Metric(name="sessions")], dimensions=[Dimension(name="country"), Dimension(name="browser")], ) response = client.run_pivot_report(request) print_run_pivot_report_response(response) def print_run_pivot_report_response(response): """Prints results of a runPivotReport call.""" print("Report result:") for row in response.rows: for dimension_value in row.dimension_values: print(dimension_value.value) for metric_value in row.metric_values: print(metric_value.value)
Node.js
// TODO(developer): Uncomment this variable and replace with your // Google Analytics 4 property ID before running the sample. // propertyId = 'YOUR-GA4-PROPERTY-ID'; // Imports the Google Analytics Data API client library. const {BetaAnalyticsDataClient} = require('@google-analytics/data'); // Initialize client that will be used to send requests. This client only // needs to be created once, and can be reused for multiple requests. const analyticsDataClient = new BetaAnalyticsDataClient(); // Runs a pivot query to build a report of session counts by country, pivoted // by the browser dimension. async function runPivotReport() { const [response] = await analyticsDataClient.runPivotReport({ property: `properties/${propertyId}`, dateRanges: [ { startDate: '2021-01-01', endDate: '2021-01-30', }, ], pivots: [ { fieldNames: ['country'], limit: 250, orderBys: [ { dimension: { dimensionName: 'country', }, }, ], }, { fieldNames: ['browser'], offset: 3, limit: 3, orderBys: [ { metric: { metricName: 'sessions', }, desc: true, }, ], }, ], metrics: [ { name: 'sessions', }, ], dimensions: [ { name: 'country', }, { name: 'browser', }, ], }); printPivotReportResponse(response); } runPivotReport(); // Prints results of a runReport call. function printPivotReportResponse(response) { console.log('Report result:'); response.rows.forEach((row) => { row.dimensionValues.forEach((dimensionValue) => { console.log(dimensionValue.value); }); row.metricValues.forEach((metricValue) => { console.log(metricValue.value); }); }); }
Demo application
See the Google Analytics API v1 Pivot Report Demo application for an example of how to build and display a pivot report using JavaScript.