新しく開設された
Discord コミュニティに参加して、リアルタイムのディスカッション、ユーザー同士のサポート、メリディアン チームとの直接の交流をお楽しみください。
最適化データの見方
コレクションでコンテンツを整理
必要に応じて、コンテンツの保存と分類を行います。
最適化は、次の期間の予算配分を決める際に役立ちます。メリディアンでは、複数の方法で予算の最適化を確認できます。
最適化シナリオを実行する:
固定予算のシナリオ: 特定の予算で複数のチャネルに最適な形で予算を配分する方法を特定し、全体的な費用対効果(ROI)を最大化します。
目標費用対効果を設定した柔軟な予算のシナリオ: 全体的な ROI の目標最小値を維持しながら、総収益の増分を最大化します。
目標限界費用対効果を設定した柔軟な予算のシナリオ: 各チャネルで目標最小値の限界費用対効果を達成しながら、各チャネルに投じる最大額を決定するのに役立ちます。
リーチとフリークエンシーのデータを利用するチャネルの最適なフリークエンシーを計算する。
カスタムの期間を指定して、Google ドライブにエクスポートできる 2 ページの HTML 最適化レポートを生成する。
最適化の結果の概要を生成して、レポートや可視化データをカスタマイズしたり、別の形式にエクスポートしたりする。こうした数値の概要で、チャネル別に結果を分類して詳細情報を確認すると、最適化された結果と最適化されていない結果を比較できます。
最適化のデータをプロットして可視化することで、制約、予算、データ、チャネル名をカスタマイズしてシナリオを比較する。
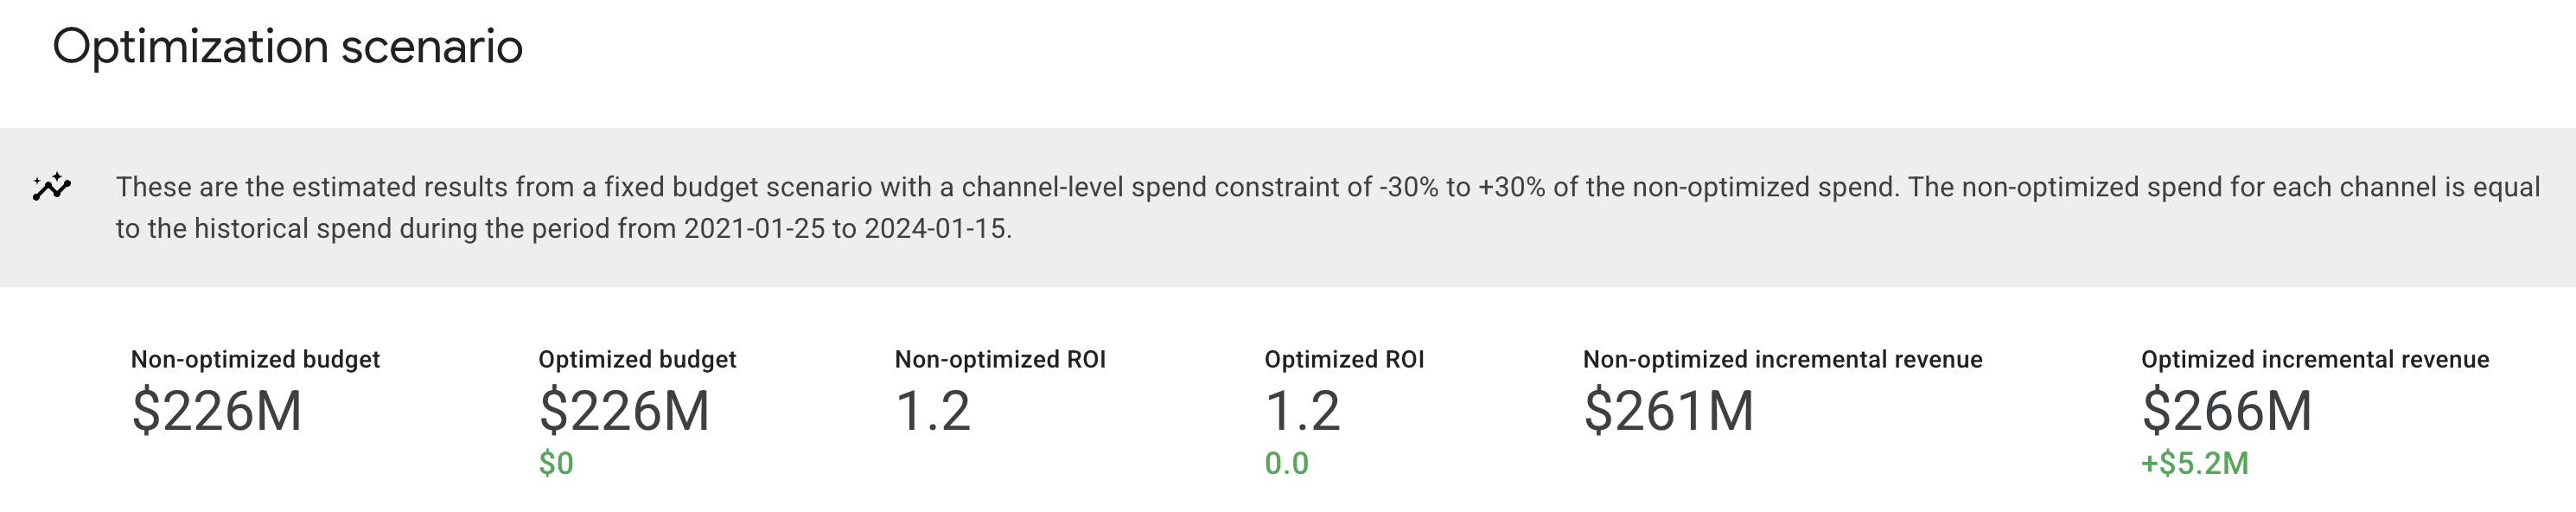
最適化シナリオの概要
最適化シナリオの概要の表は、HTML 出力にのみ表示されます。予算、ROI、収益または KPI の増分の現在値(最適化されていない値)と最適化された値を、設定したシナリオタイプで大まかに比較できます。また、このセクションには、チャネル単位で費用に指定した制約と、予算最適化のベンチマーク期間が表示されます。
次の例は、固定予算の最適化シナリオの推定結果を示しています。この場合、現在の ROI と最適化された ROI の間に大きな違いはありません。一般的に、最適化された ROI は常に現在の ROI 以上になります。
(画像をクリックすると拡大します)
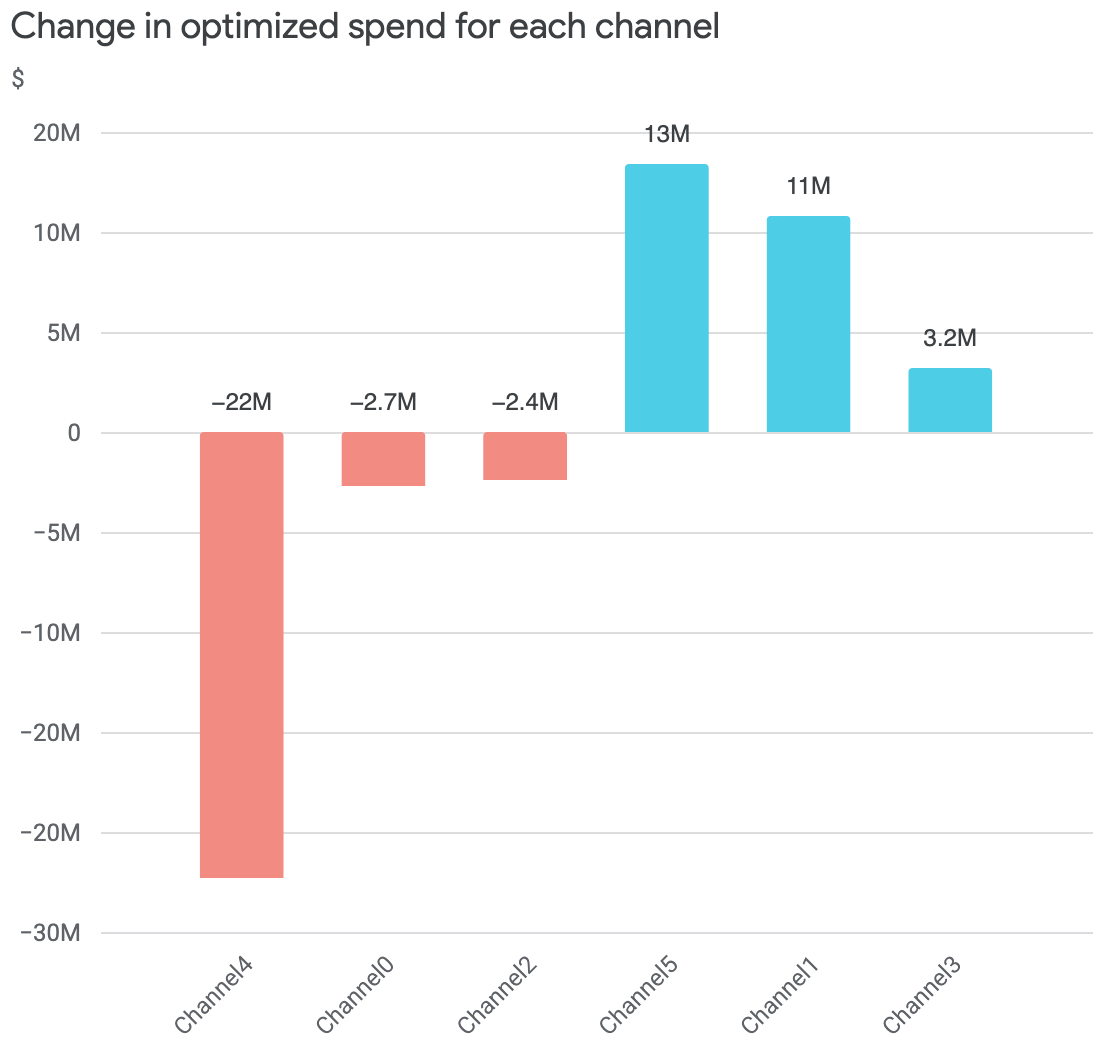
各チャネルの最適化された費用の増減
このグラフは、予算最適化で推奨される費用の増減をチャネル別に示しています。「増減」は、最適化された費用と現在の費用の差を意味します。
次の例は固定予算の最適化であるため、予算の純増減は 0 です。
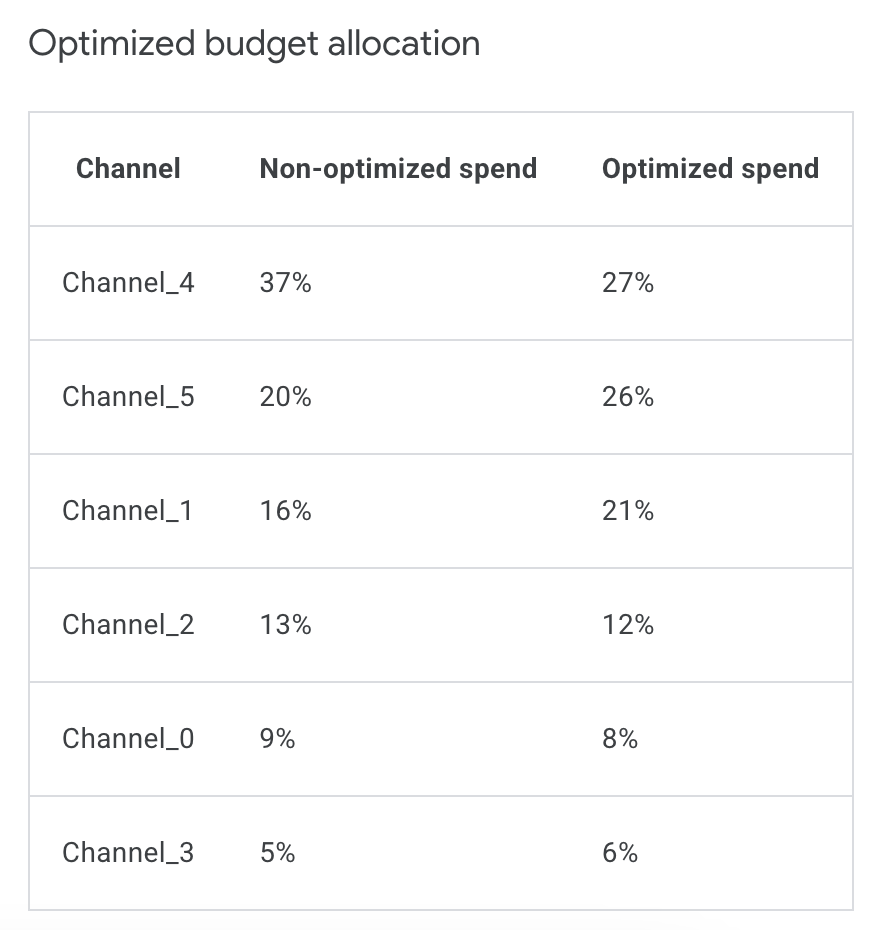
最適化された予算配分
最適化された予算配分の表では、最適化されていない予算シナリオと最適化された予算シナリオで、各チャネルの費用の割合を比較できます。これにより、最適化された予算シナリオに基づいて、各チャネルで行える予算増減を特定できます。
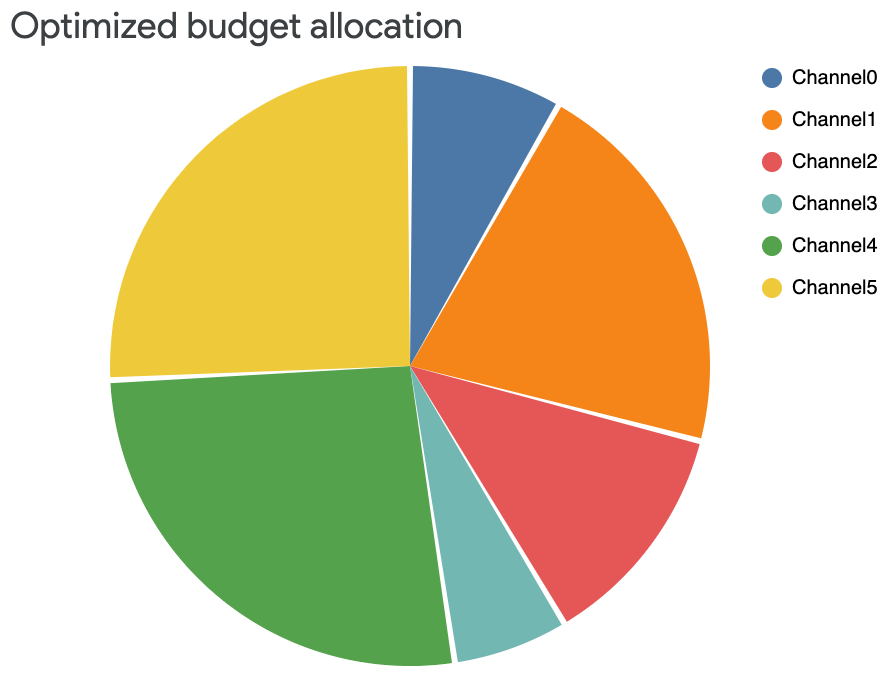
対応する円グラフには、最適化された予算配分の表に基づく、最適化された費用配分のみが表示されます。次の例では、最適化された予算全体の約半分がチャネル 4 とチャネル 5 に配分されています。この方法でも、最適化された予算配分を確認できます。
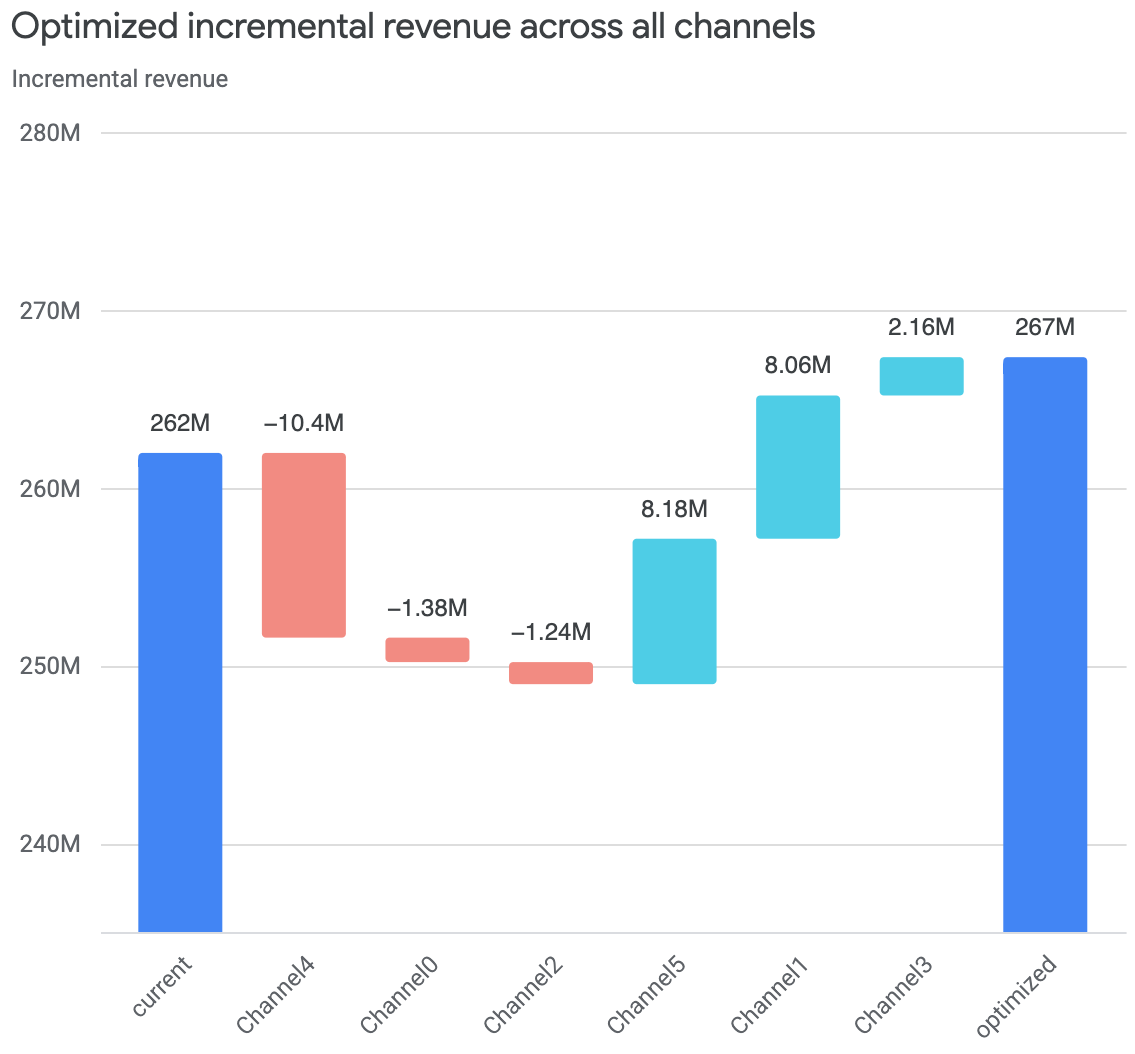
すべてのチャネルで収益の増分を最適化
すべてのチャネルで収益の増分を最適化したグラフには、最適な予算配分を行った場合の各チャネルの効果の推定値と、これまでの予算配分から最適な予算配分に移行した場合の効果の差異が表示されます。
可視化データの左側には、現在収益または KPI の増分が表示されます。右側には、収益または KPI の増分を最適化するために推奨される、チャネルごとの増減幅が表示されます。
次の例は、現在の収益が 2 億 6,200 万ドルであることを示しています。予算配分を最適化すると、一部のチャネルでは収益の増分が減少しますが、他のチャネルでは収益の増分が増加し、全体的な収益の増分は 2 億 6,700 万ドルに高まることがわかります。
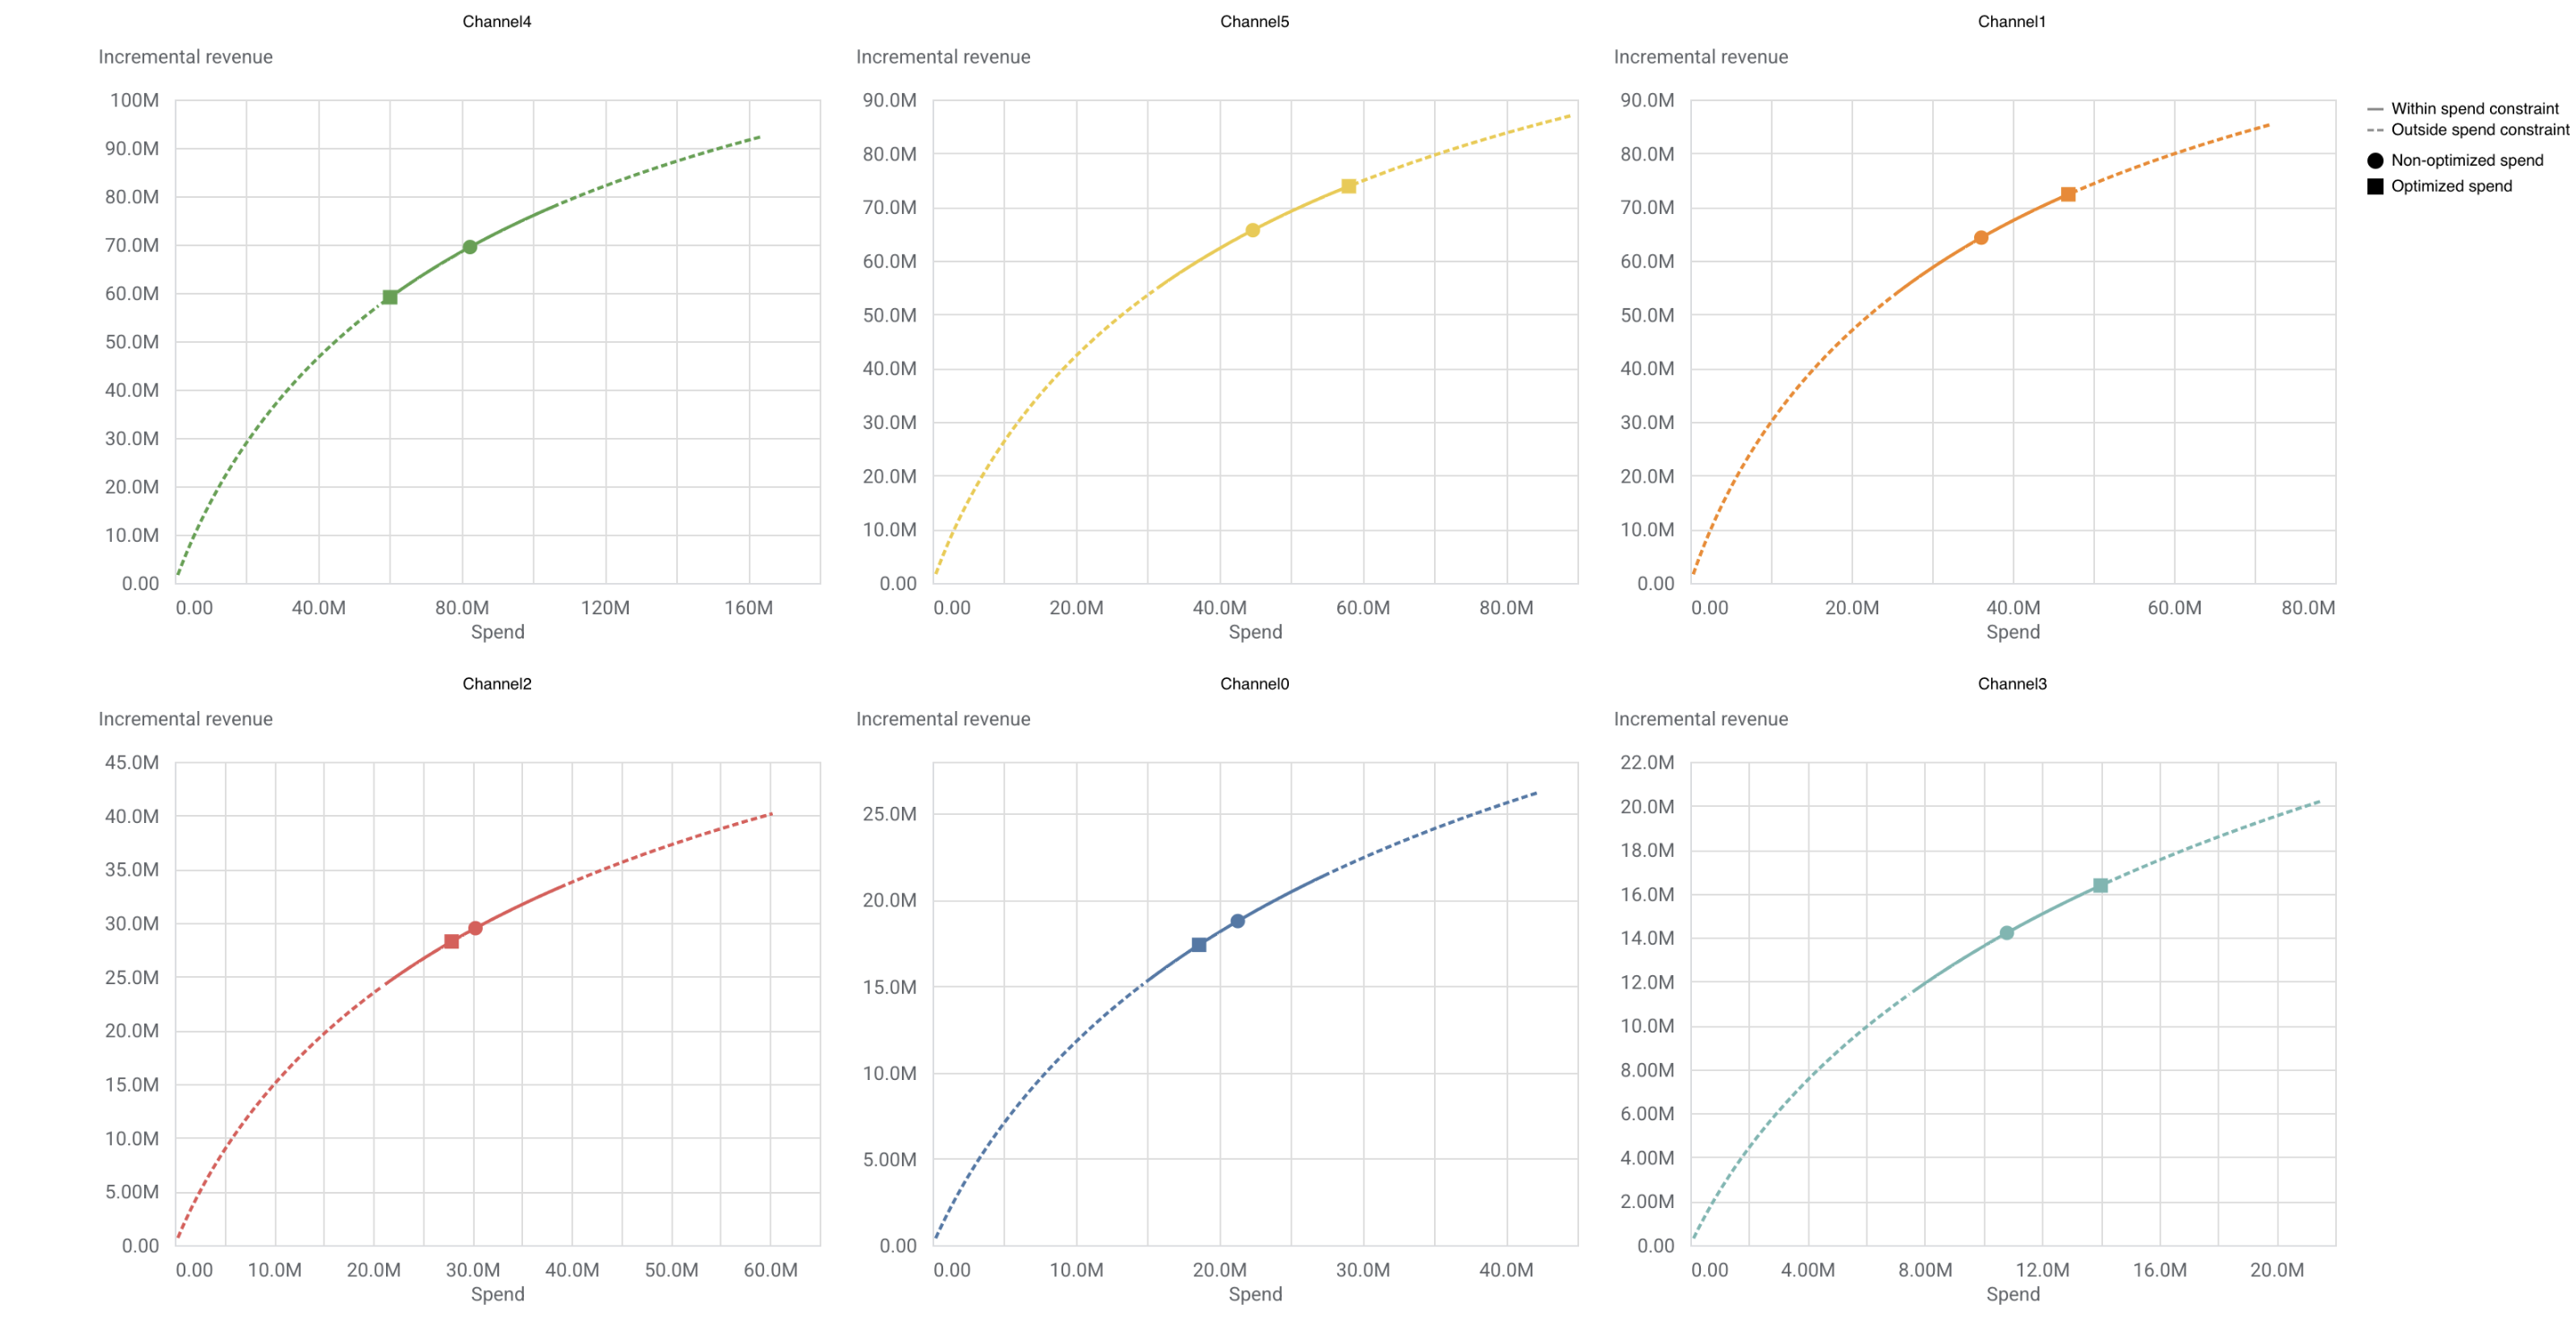
応答曲線に基づく予算の最適化
応答曲線は、費用の関数として収益の増分を示します。現在の費用レベルと最適な費用レベルが、この曲線上の点としてプロットされます。応答曲線を見ると、費用あたりの効果が減少していく様子がわかるため、これも予算を決める際の参考になります。
応答曲線のグラフでは、実線は最適化に設定した費用の制約範囲を表します。点線は制約外の費用を表します。
このグラフには、次の 2 つの点も示されます。
- 丸い点は、現在の費用レベルを表します
- 四角い点は、最適化された費用レベルを表します
(画像をクリックすると拡大します)
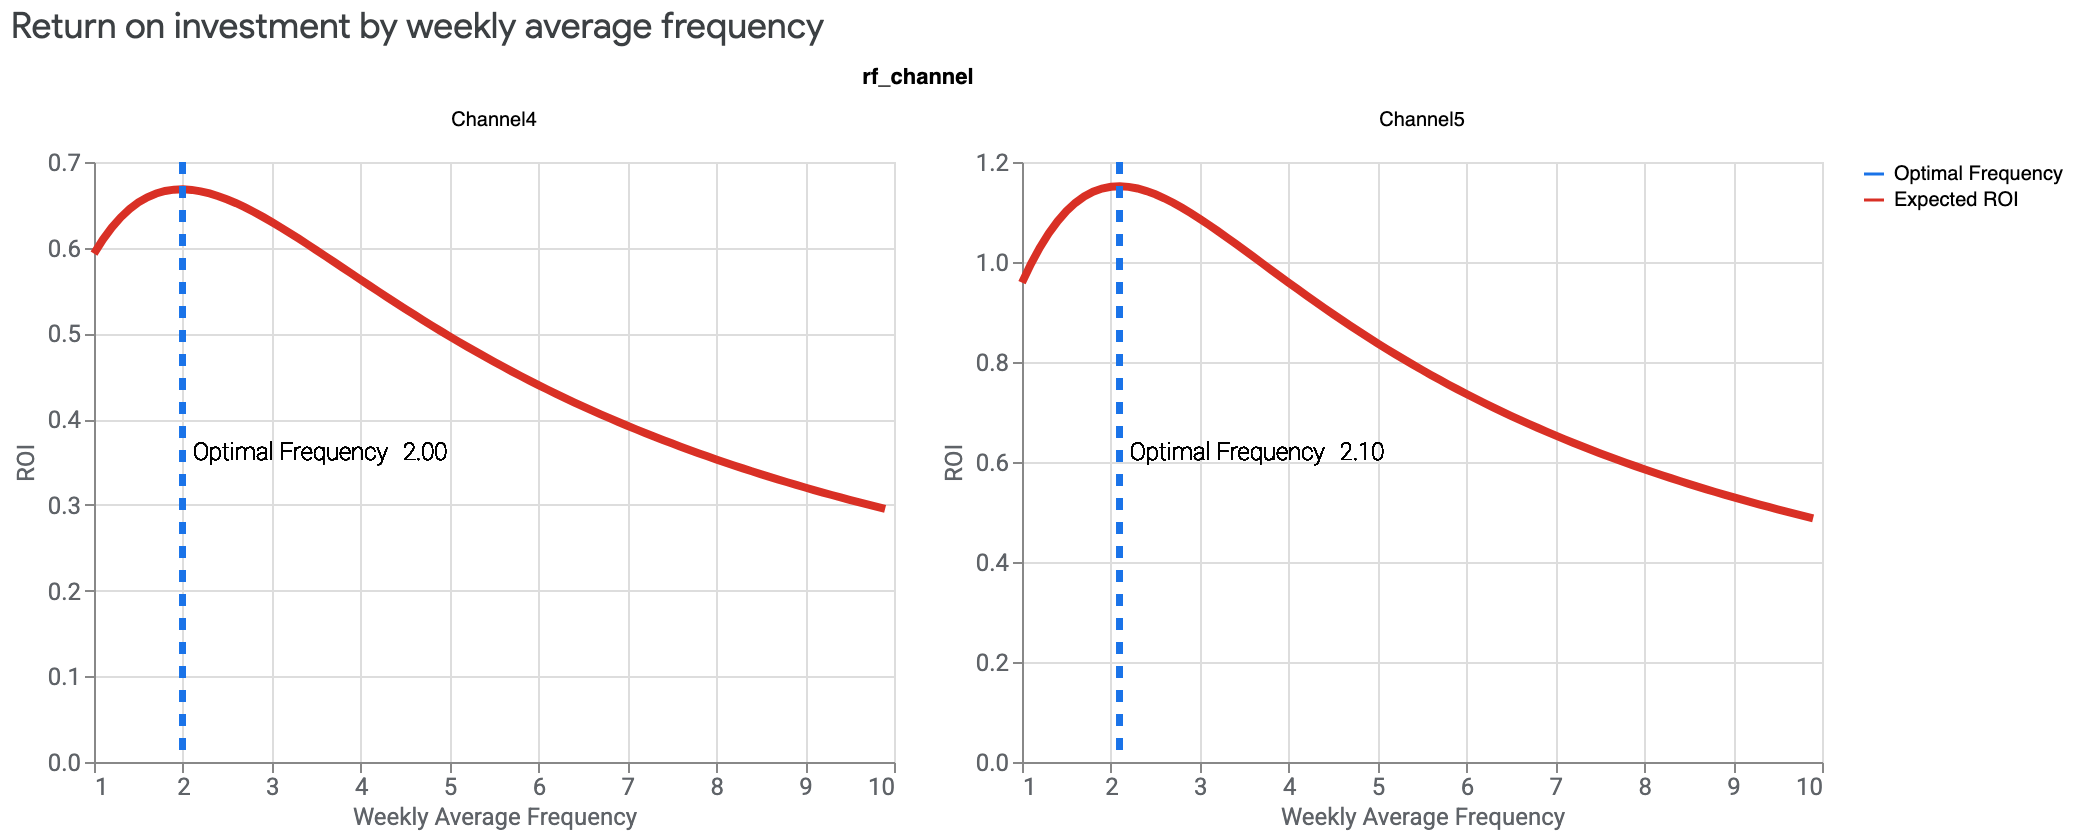
最適なフリークエンシー
このグラフは、平均フリークエンシーの関数としての ROI を示しています。この平均フリークエンシーは、すべての地域と期間に適用されていると想定しています。
最適なフリークエンシーとは、ROI を最大化するために、地域と期間ごとにターゲット オーディエンスに広告を表示する回数の平均値です。メリディアンのモデル仕様では、最適なフリークエンシーは予算配分に依存しません。
1 つ以上のメディア チャネルについて、リーチとフリークエンシーのデータがある場合は、最適なフリークエンシーを可視化できます。
次の例は、各チャネルの最適なフリークエンシーがそれぞれ 2 と 2.1 であり、チャネル 5 では推定 ROI が大幅に高くなることを示しています。
(画像をクリックすると拡大します)
特に記載のない限り、このページのコンテンツはクリエイティブ・コモンズの表示 4.0 ライセンスにより使用許諾されます。コードサンプルは Apache 2.0 ライセンスにより使用許諾されます。詳しくは、Google Developers サイトのポリシーをご覧ください。Java は Oracle および関連会社の登録商標です。
最終更新日 2025-08-04 UTC。
[[["わかりやすい","easyToUnderstand","thumb-up"],["問題の解決に役立った","solvedMyProblem","thumb-up"],["その他","otherUp","thumb-up"]],[["必要な情報がない","missingTheInformationINeed","thumb-down"],["複雑すぎる / 手順が多すぎる","tooComplicatedTooManySteps","thumb-down"],["最新ではない","outOfDate","thumb-down"],["翻訳に関する問題","translationIssue","thumb-down"],["サンプル / コードに問題がある","samplesCodeIssue","thumb-down"],["その他","otherDown","thumb-down"]],["最終更新日 2025-08-04 UTC。"],[[["\u003cp\u003eMeridian budget optimization helps determine the best budget allocation across channels to maximize ROI or incremental revenue.\u003c/p\u003e\n"],["\u003cp\u003eYou can run different optimization scenarios, including fixed budget, flexible budget with target ROI, and flexible budget with target marginal ROI.\u003c/p\u003e\n"],["\u003cp\u003eMeridian provides various visualizations and reports to understand the optimization results, such as optimized spend change by channel, budget allocation, and incremental revenue impact.\u003c/p\u003e\n"],["\u003cp\u003eIf reach and frequency data are available, Meridian can calculate the optimal frequency for maximizing ROI on those channels.\u003c/p\u003e\n"],["\u003cp\u003eOptimization results can be viewed in an HTML report, customized visualizations, or exported for further analysis.\u003c/p\u003e\n"]]],["Meridian offers tools to optimize budget allocation and maximize ROI. Key actions include running budget optimization scenarios: fixed budget, flexible budget with target ROI, or flexible budget with target marginal ROI. Users can calculate optimal frequency, generate HTML or custom reports, and compare optimized vs. non-optimized results. Visualizations depict budget allocation, incremental revenue changes, and response curves. The optimal frequency plot indicates the best advertisement exposure rate to maximize ROI.\n"],null,["# Interpret the optimizations\n\nOptimizations help guide how to allocate the budget for the next period.\nMeridian provides several ways to view the budget optimizations:\n\n- [Run optimization scenarios](/meridian/docs/user-guide/budget-optimization-scenarios):\n\n - **Fixed budget scenario:** Helps you find the optimal allocation across\n channels for a given budget to maximize the overall ROI.\n\n - **Flexible budget scenario with target ROI:** Helps maximize your total incremental revenue\n while also maintaining a target minimum overall ROI.\n\n - **Flexible budget scenario with target marginal ROI:** Helps determine the maximum amount you can\n spend on each channel and while still achieving a target minimum marginal\n ROI on each channel.\n\n- [Calculate optimal frequency](/meridian/docs/user-guide/optimize-frequency) for\n channels that utilize reach and frequency data.\n\n- [Generate a two-page optimization HTML report](/meridian/docs/user-guide/generate-optimization-results-output)\n with a custom time range that can be exported to your Google drive.\n\n- [Generate an optimization results summary](/meridian/docs/user-guide/plot-optimization-visualizations)\n to customize your own reports, visualizations, or export them to another\n format. These numerical summaries let you access more detail, breaking down\n the results by channel so you can compare the optimized and non-optimized\n results.\n\n- [Plot optimization visualizations]() to compare scenarios with customized\n constraints, budgets, data, and channel names.\n\nOptimization scenario summary\n-----------------------------\n\nThe **Optimization scenario** summary table is displayed in the HTML output\nonly. It shows a macro-level comparison of the current (non-optimized) and\noptimized budget, ROI, and incremental revenue or KPI for the scenario type you\nconfigured. Additionally, this section shows the constraints you specified on\nspending at the channel level and the benchmark time period for budget\noptimization.\n\nThe following example shows the estimated results from a fixed budget\noptimization scenario. In this case, there is no significant change\nbetween the current ROI and optimized ROI. In general, the optimized ROI will\nalways be at least as high as the current ROI.\n\n(*Click the image to enlarge.*)\n\nChange in optimized spend for each channel\n------------------------------------------\n\nThis chart shows the budget optimization recommended spend change by channel.\n*Change* is defined as the difference between optimized and current spend.\n\nThe following example is for a fixed budget optimization, so the net budget\nchange is zero.\n\nOptimized budget allocation\n---------------------------\n\nThe **Optimized budget allocation** table compares the percent of spend on each\nchannel between the non-optimized and optimized budget scenarios. This helps you\nidentify actionable budget changes for each channel based on the optimized\nbudget scenario.\n\nThe corresponding pie chart shows only the optimized spend allocation from the\n**Optimized budget allocation** table. In the following example you can see that\napproximately half of the overall optimized budget is allocated to channel 4 and\nchannel 5. It's another way of looking at the optimized budget allocation.\n\nOptimized incremental revenue across all channels\n-------------------------------------------------\n\nThe **Optimized incremental revenue across all channels** chart shows the\nestimated impact of each channel under the optimal budget allocation, and the\nimpact difference associated with moving from the historical to the optimal\nbudget allocation.\n\nThe visualization shows the current incremental revenue or KPI on the far left\nside. Then it shows the recommended differences per channel to reach the\noptimized incremental revenue or KPI on the far right side.\n\nThe following example shows that the current revenue is 262 million. You can see\nthat the optimized budget allocation reduces the incremental revenue on some\nchannels, but increases the incremental revenue on other channels, increasing\nthe overall incremental revenue to 267 million.\n\nOptimized budget on response curves\n-----------------------------------\n\nResponse curves show incremental revenue as a function of spend. The current\nand optimal spend levels are plotted as points on this curve. Response curves\nshow how the return per monetary unit spent eventually diminishes, which can\nfurther guide budget decisions.\n\nIn the response curve charts, the solid line represents the spend constraint\nbounds that you set for the optimization. The dotted line represents spending\noutside of the constraints.\n\nThe plot also indicates two points:\n\n- The circle represents the current spend level\n- The square represents the optimized spend level\n\n(*Click the image to enlarge.*)\n\nOptimal frequency\n-----------------\n\nThis plot shows ROI as a function of average frequency, assuming this average\nfrequency is applied to all geos and time periods.\n\n[Optimal frequency](/meridian/docs/basics/optimization-with-reach-frequency) is\nthe average number of times an advertisement should be shown to the target\naudience for each geo and time period to maximize the ROI. Note that\nin the Meridian model specification, the optimal frequency does not\ndepend on the budget allocation.\n\nIf you have reach and frequency data for one or more media channels, you can\ngenerate optimal frequency visualizations.\n\nThe following example shows that the optimal frequency on each channel is 2 and\n2.1 respectively with a much larger ROI predicted for channel 5.\n\n(*Click the image to enlarge.*)"]]