من المهم مراجعة معلومات استخدام واجهة برمجة التطبيقات في Google Maps Platform والحصة ومعلومات الفوترة بانتظام. تساعدك هذه المعلومات في قياس استخدام واجهة برمجة التطبيقات والبقاء ضمن حدود الاستهلاك المحدّدة مسبقًا والتحكّم في التكاليف من خلال الميزانيات المخطّط لها. يمكن أن تساعدك مراجعة هذه المعلومات أيضًا في رصد أي تفاعلات غير متوقّعة قد تحدث بين تطبيقاتك وخدمات "منصّة خرائط Google".
توفّر منصة "خرائط Google" أداتَين يمكن أن تساعداك في مراجعة معلومات الاستخدام والحصة والفوترة:
- إعداد التقارير: مجموعة من التقارير المرئية المحدّدة مسبقًا التي تتيح لك الاطّلاع بسهولة على معلومات الاستخدام الأساسي لواجهة برمجة التطبيقات والحصة والفوترة في وحدة تحكّم Google Cloud. يمكنك تحديد عدد طلبات البيانات من واجهة برمجة التطبيقات بسرعة، والاطّلاع على مدى اقترابك من بلوغ حصص استخدام واجهة برمجة التطبيقات، ومراقبة استخدام الفوترة بمرور الوقت.
المراقبة: مجموعة من الأدوات، سواء في وحدة تحكّم Cloud أو من خلال واجهة برمجة تطبيقات، تتيح لك مراقبة استخدام واجهة برمجة التطبيقات والحصة ومعلومات الفوترة وتحديد التنبيهات عند اقتراب أيّ من هذه المقاييس من حدٍّ محدّد مسبقًا.
تتيح لك ميزة "المراقبة" إنشاء لوحات مراقبة مخصّصة تعرض المقاييس بأنواع مختلفة من الرسوم البيانية. يمكنك أيضًا إصدار إشعارات تنبيه، مثل الرسائل الإلكترونية أو الرسائل القصيرة، عندما يتجاوز أحد المقاييس حدًا مُحدَّدًا مسبقًا.
إعداد التقارير
إعداد التقارير: توفّر "منصّة خرائط Google" مجموعة من التقارير المرئية المحدّدة مسبقًا التي تتيح لك الاطّلاع بسهولة على معلومات الاستخدام الأساسي لواجهة برمجة التطبيقات والحصة وبيانات الفوترة في وحدة تحكّم Cloud. يمكنك الاطّلاع على تقارير استخدام واجهة برمجة التطبيقات Maps Platform API والحصة وأرقام الفوترة باستخدام وحدة تحكّم السحابة الإلكترونية.
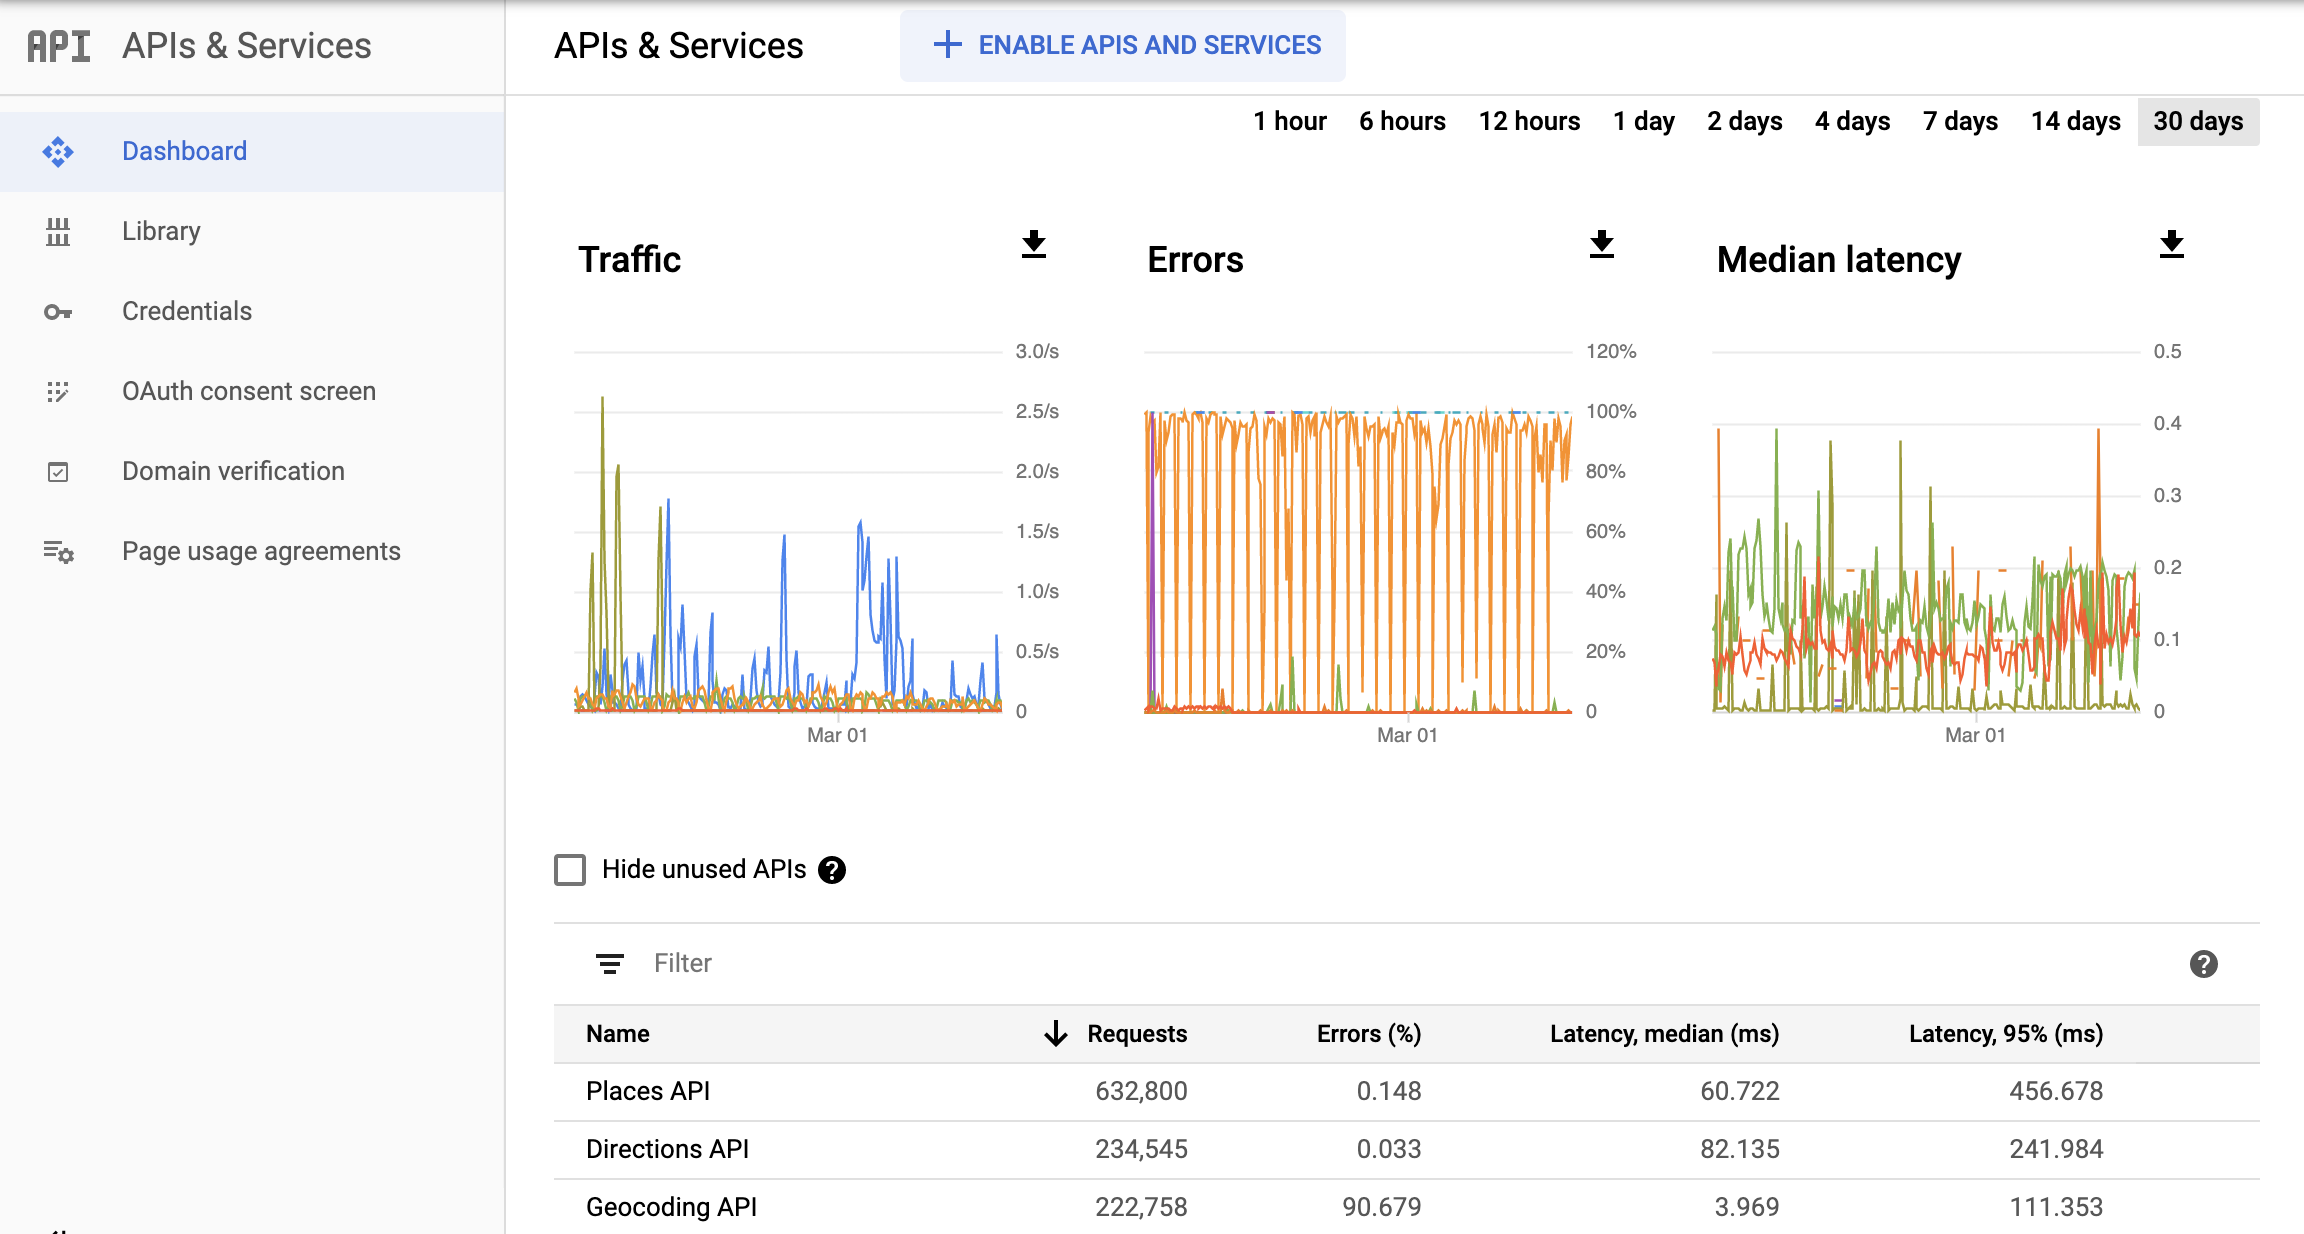
تقارير واجهات برمجة التطبيقات والخدمات
تعرض هذه الصورة تقرير واجهات برمجة التطبيقات والخدمات.
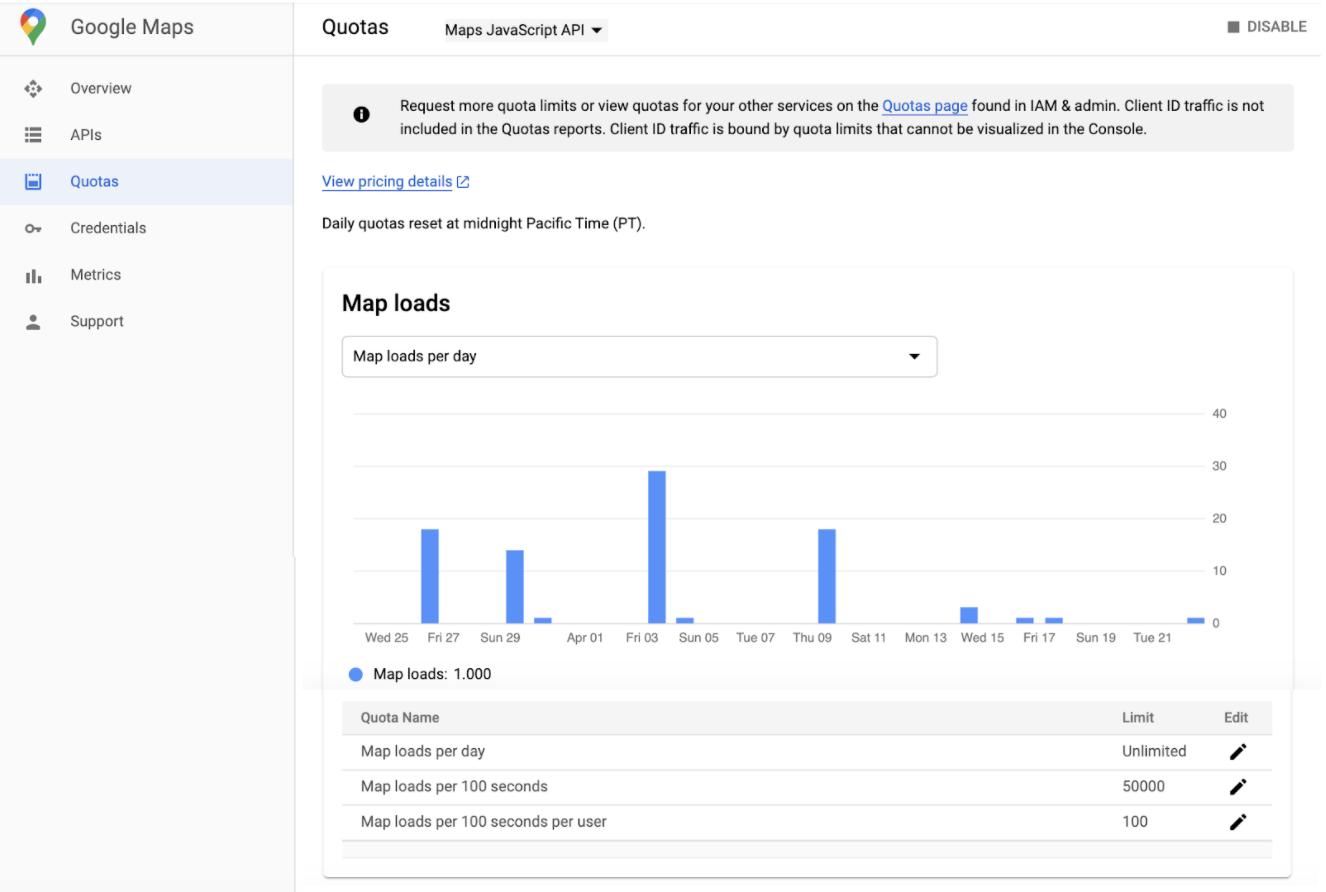
الحصص
تضع الحصص حدودًا لعدد الطلبات التي يمكن لمشروعك إرسالها إلى واجهتَي برمجة التطبيقات Maps Platform API. يمكن أن تكون الطلبات محدودة بثلاث طرق:
- يوميًا
- بالدقيقة
- لكل مستخدم في الدقيقة (حيثما كان ذلك متاحًا)
لا يتم احتساب سوى الطلبات الناجحة والطلبات التي تؤدي إلى حدوث أخطاء في الخادم ضمن الحصة. لا يتم احتساب الطلبات التي يتعذّر فيها إثبات الهوية ضمن الحصة.
يتم عرض استخدام الحصة في الرسوم البيانية ضمن صفحة تقرير الحصص في Cloud Console.
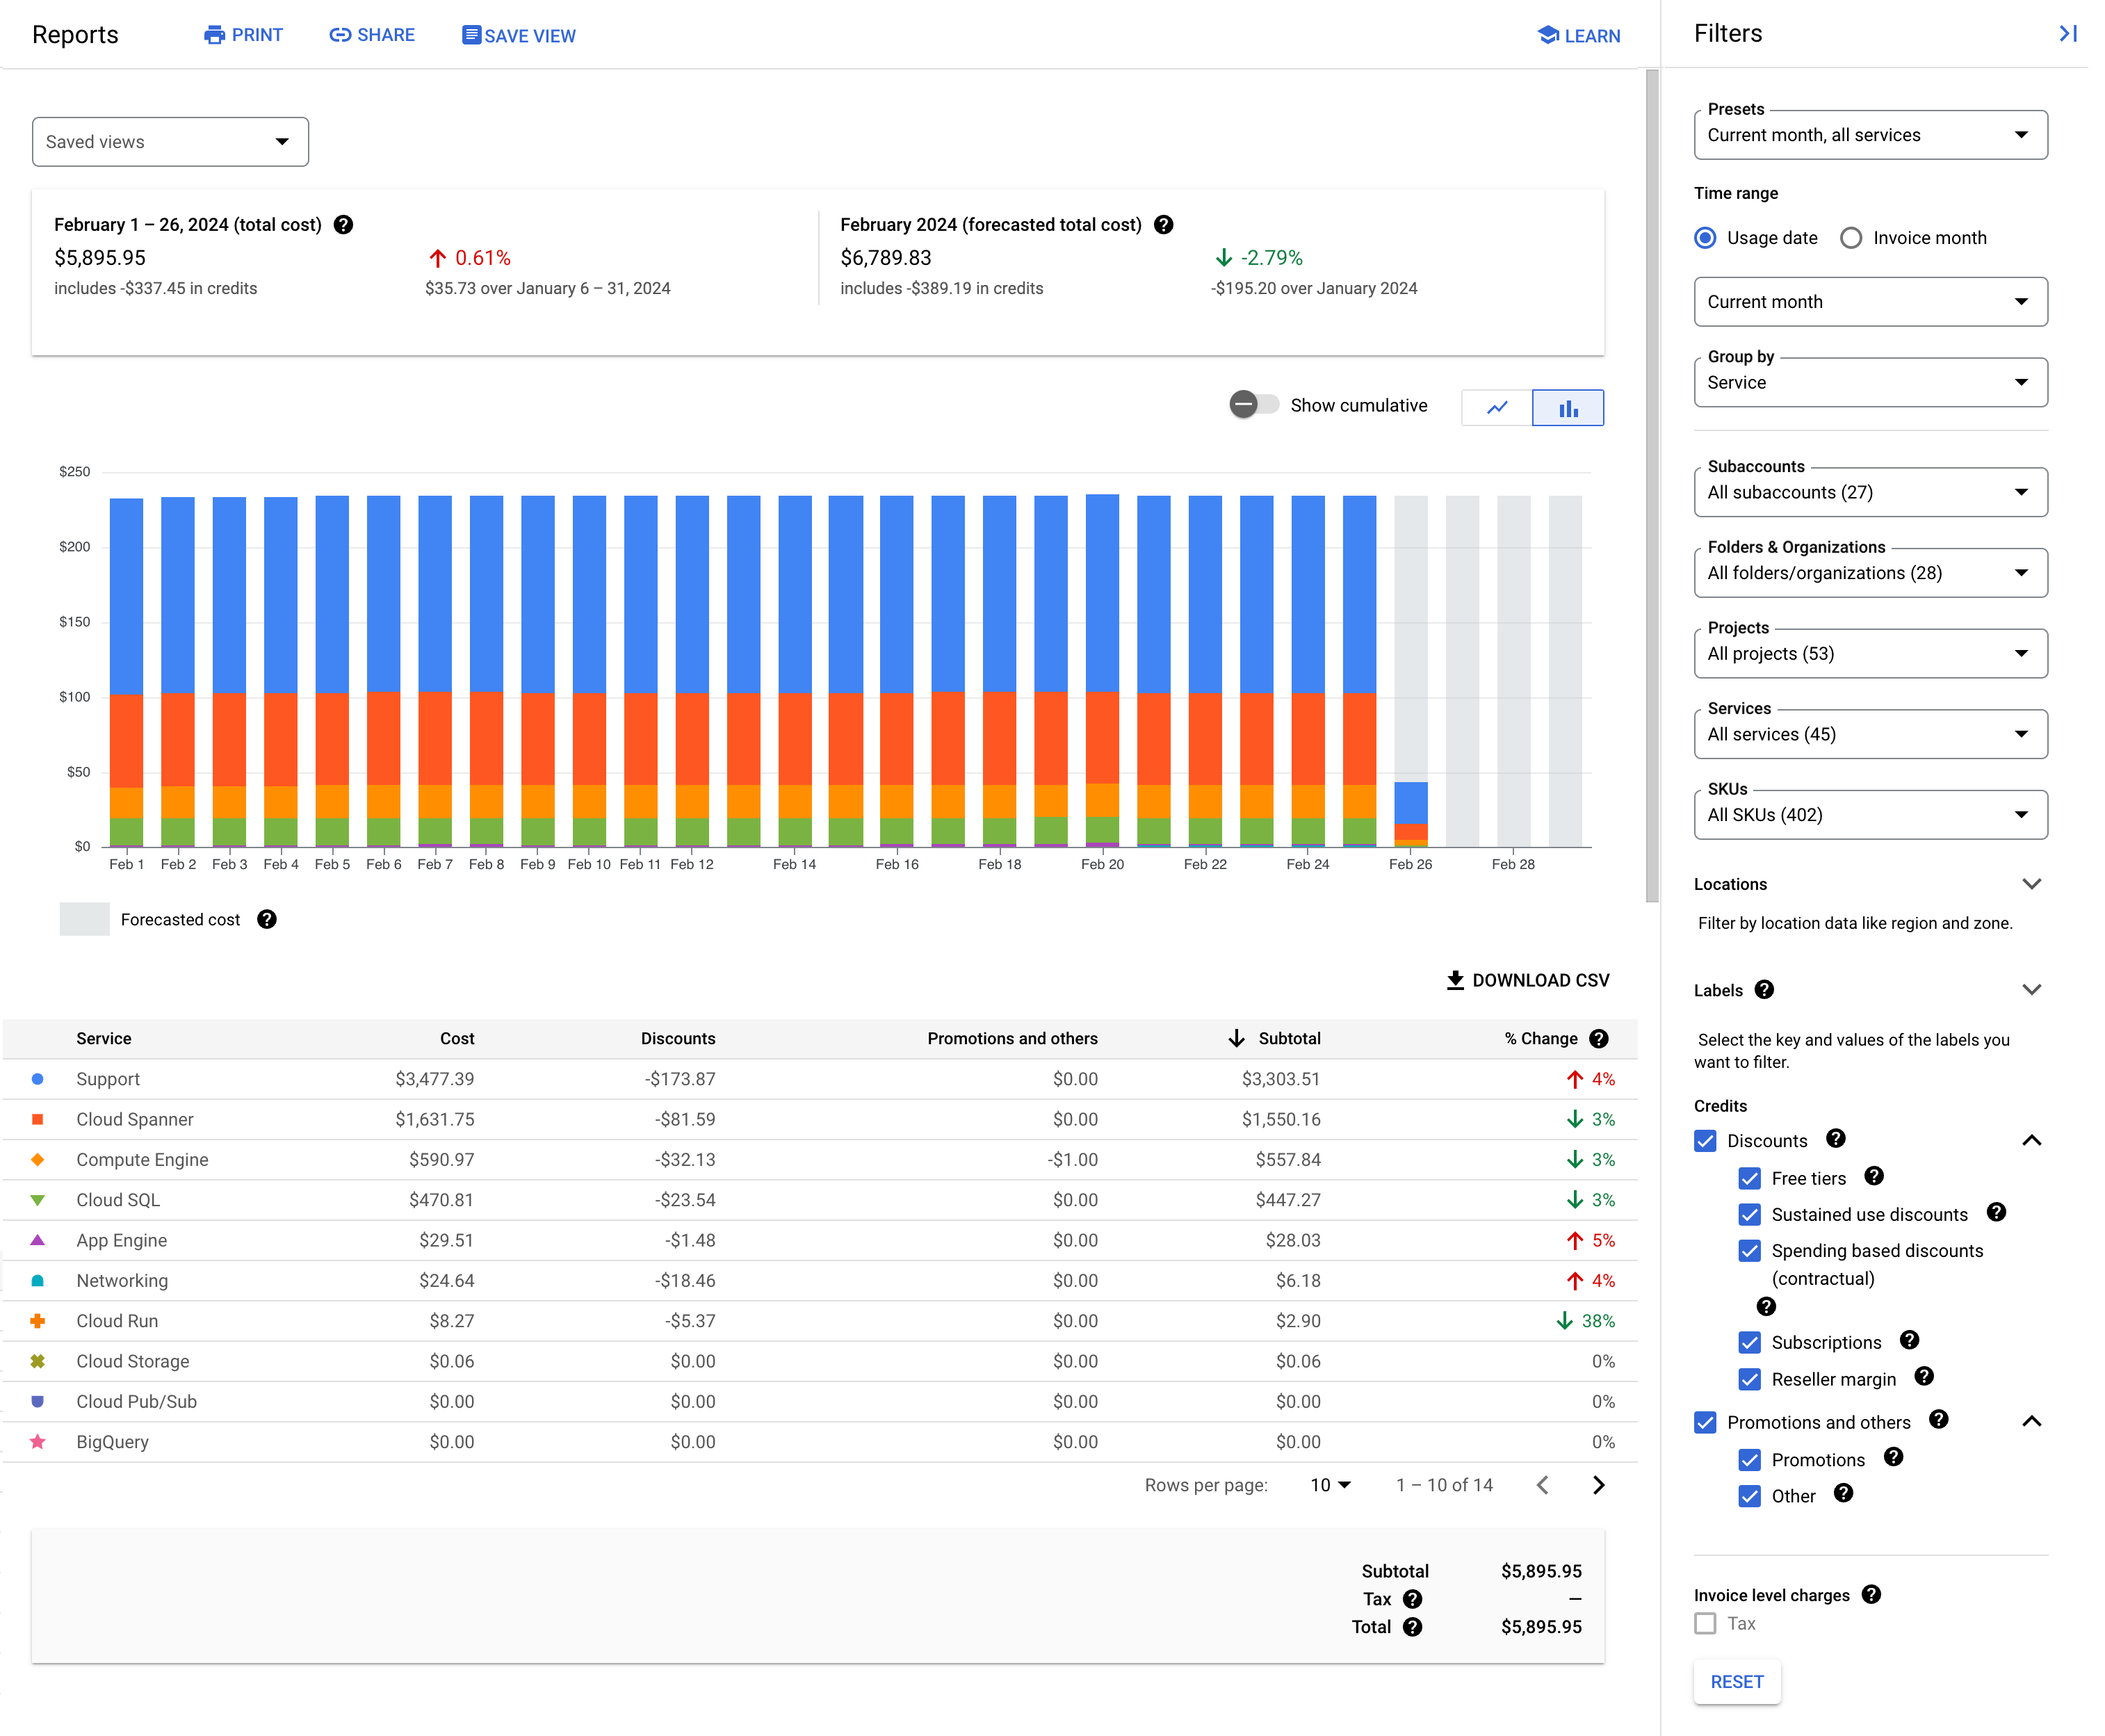
الفوترة
تقدّم تقارير الفوترة في وحدة تحكّم Cloud معلومات عن الفوترة والتكاليف ذات الصلة بالمشروع الذي اخترته.
تتيح لك صفحة "تقارير الفوترة في Cloud" الاطّلاع على تكاليف استخدام Google Cloud لجميع المشاريع المرتبطة بحساب على "الفوترة في Cloud". لمساعدتك في الاطّلاع على مؤشرات التكاليف المهمة بالنسبة إليك، يمكنك اختيار نطاق بيانات وتحديد نطاق زمني وضبط فلاتر الرسم البياني والتجميع حسب المشروع أو الخدمة أو رمز التخزين التعريفي أو الموقع الجغرافي.
يمكن أن تساعدك تقارير "الفوترة في السحابة الإلكترونية" في الإجابة عن أسئلة مثل:
- ما هو مؤشر إنفاقي الحالي على Google Cloud؟
- ما هو المشروع الذي تطلّب أكبر تكلفة في الشهر الماضي؟
- ما هي التكاليف المتوقّعة في المستقبل استنادًا إلى المؤشرات السابقة؟
- ما هو مقدار الإنفاق حسب المنطقة؟
تعرض هذه الصورة تقرير الفوترة.
التتبّع
تجمع ميزة مراقبة السحابة الإلكترونية قياسات خدمتك وموارد Google Cloud التي تستخدمها. على سبيل المثال، يمكنك مراقبة طلبات البيانات من واجهة برمجة التطبيقات أو استخدام الحصة على مدار فاصل زمني معين.
لا يمكنك فقط تحديد المقاييس والرسوم البيانية المخصّصة، بل يمكنك أيضًا تحديد التنبيهات. استخدِم التنبيهات لإرسال إشعار عندما لا يستوفي أداء إحدى الخدمات المعايير التي تحدّدها. على سبيل المثال، يمكنك إرسال إشعار على شكل رسالة إلكترونية أو رسالة نصية إلى تطبيق Cloud Console للأجهزة الجوّالة وغيرها من الخيارات.
المقاييس
في "مراقبة السحابة الإلكترونية":
- يصف المقياس شيئًا يتم قياسه. تشمل أمثلة المقاييس عدد طلبات البيانات من واجهة برمجة التطبيقات أو النسبة المئوية لحصة الاستخدام المستنفَدة أو معدّل استخدام وحدة المعالجة المركزية لجهاز افتراضي.
- السلسلة الزمنية هي بنية بيانات تحتوي على قياسات مزوّدة بطابع زمني لمقياس معيّن ومعلومات عن مصدر هذه القياسات ومعناها.
لاستكشاف بيانات المقاييس، أنشئ رسمًا بيانيًا باستخدام "مستكشف المقاييس". على سبيل المثال، لعرض عدد طلبات واجهة برمجة التطبيقات على فترات دقيقة واحدة خلال الساعة الماضية، استخدِم أداة "مستكشف المقاييس" لإنشاء رسم بياني يعرض أحدث البيانات.
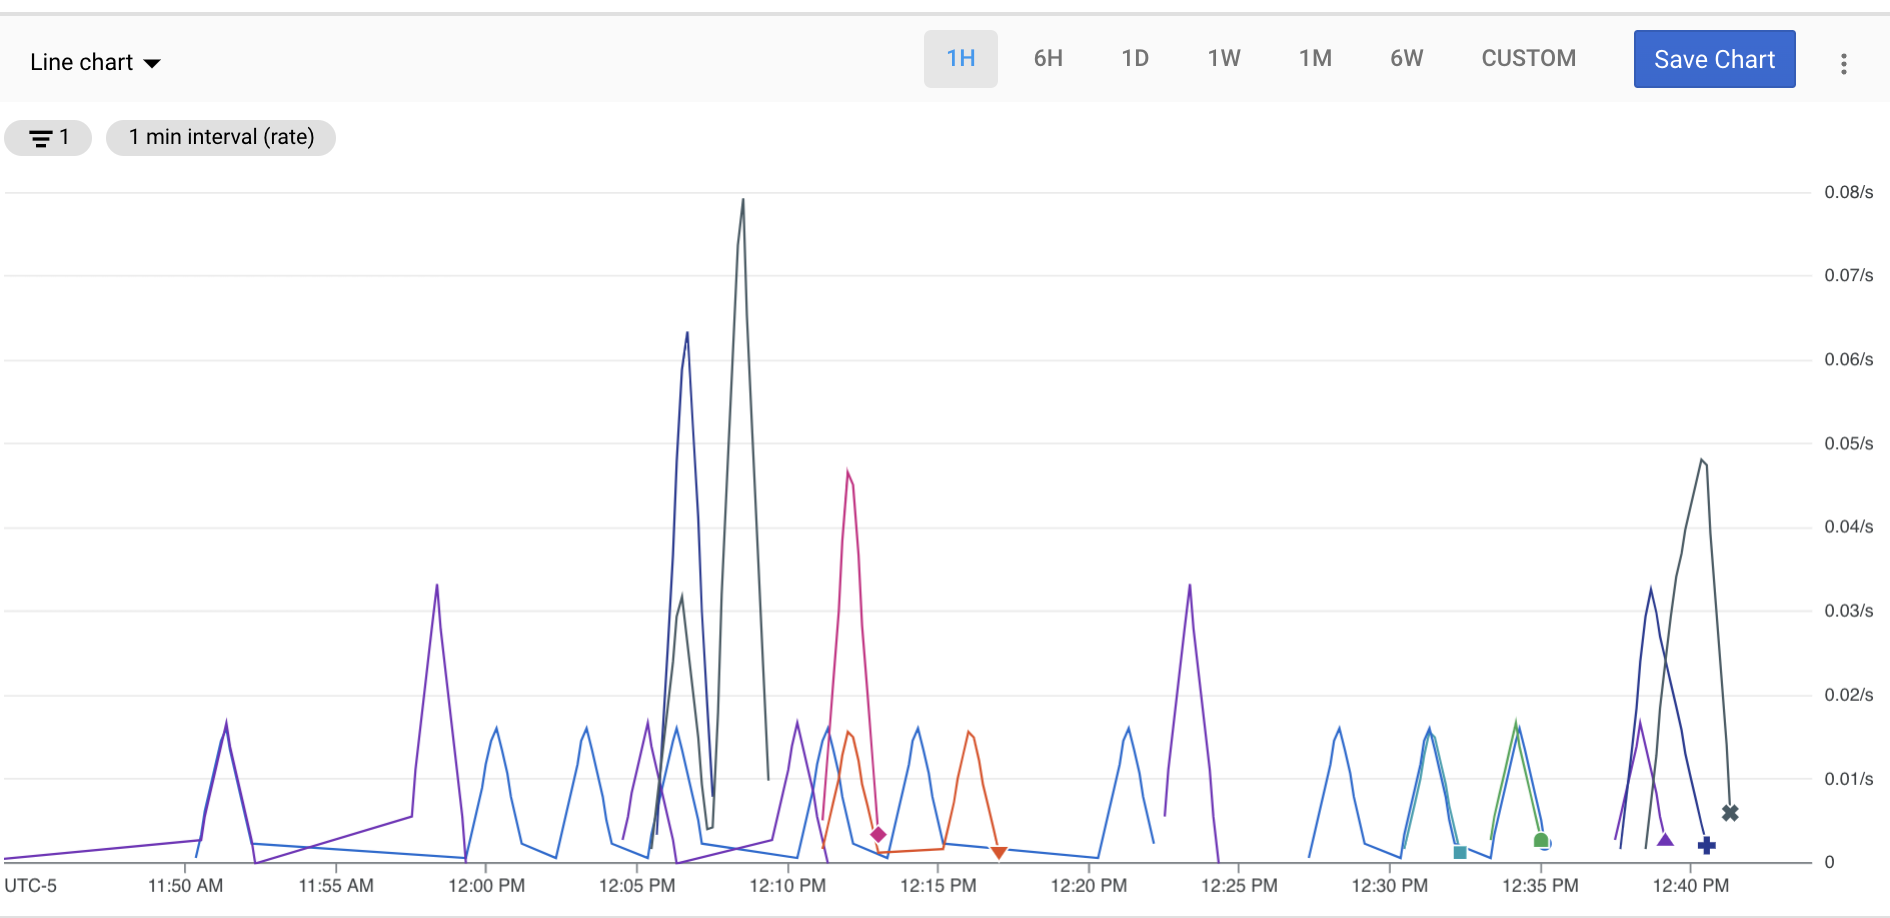
لوحات البيانات
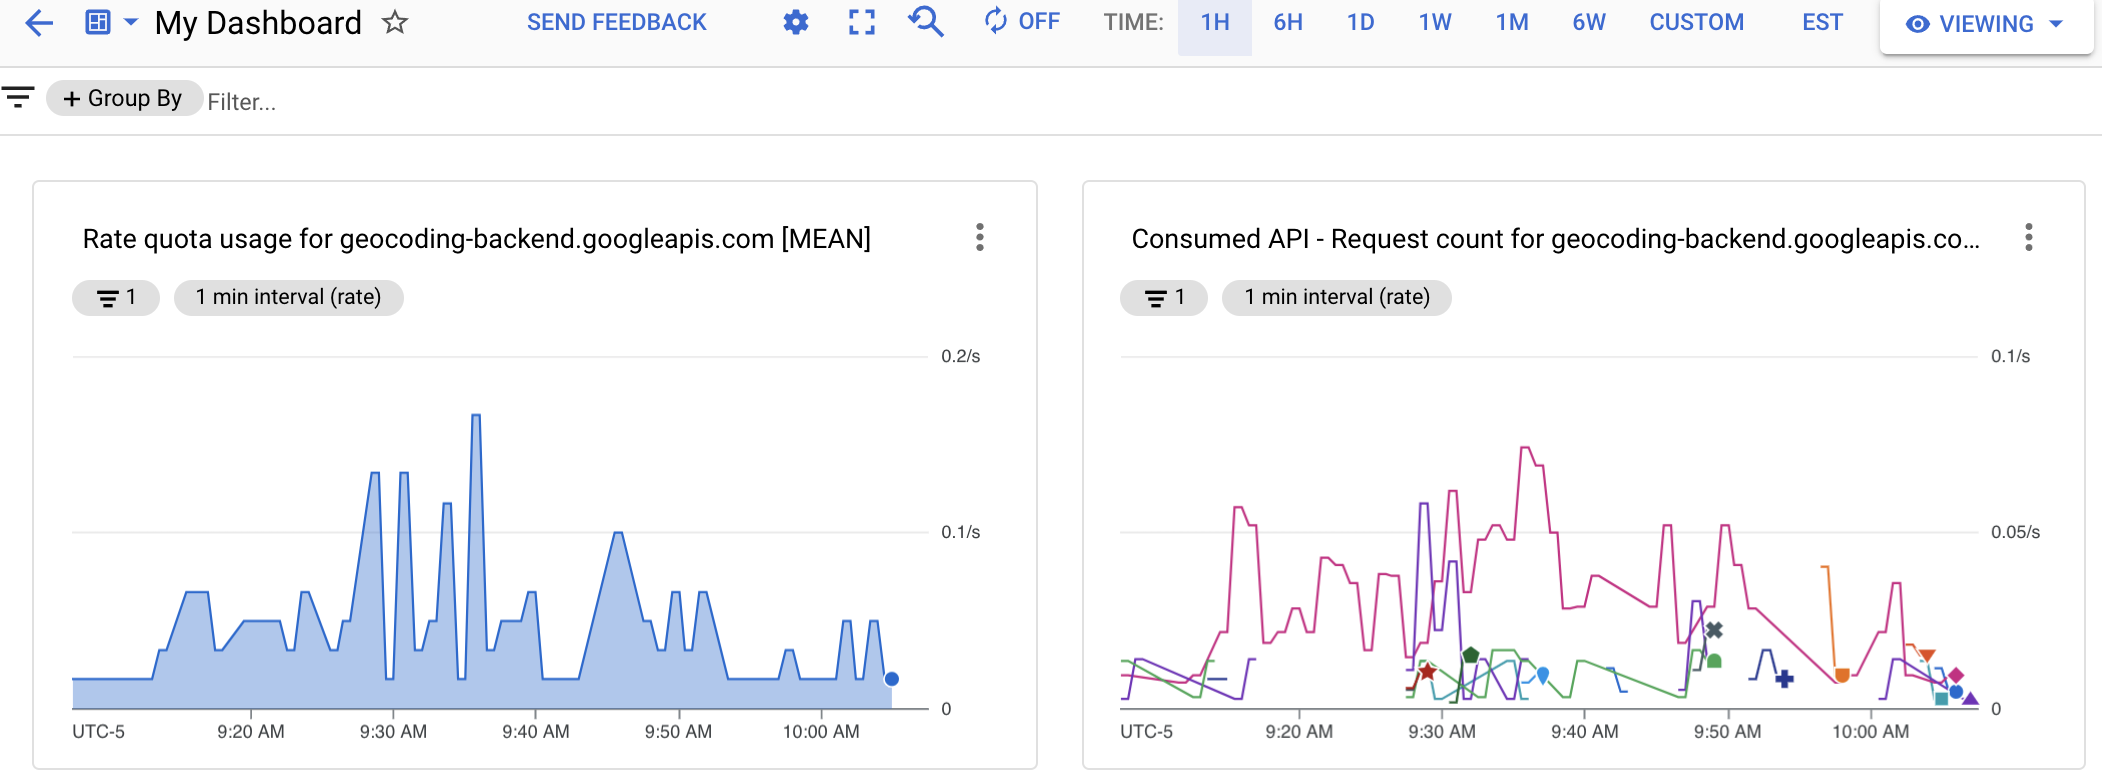
تتيح لك لوحات البيانات عرض بيانات السلاسل الزمنية وتتبُّعها كمجموعة من الرسومات البيانية. لإنشاء لوحات بيانات مخصّصة، يمكنك استخدام وحدة تحكّم Cloud أو واجهة برمجة التطبيقات Cloud Monitoring API.
تعرض الصورة التالية لوحة بيانات مخصّصة تتضمّن رسمَين بيانيَّين: رسم بياني للحصة على يمين الشاشة، ورسم بياني لعدد واجهات برمجة التطبيقات على يمين الشاشة.
التنبيهات
لتلقّي إشعارات عندما لا يستوفي أداء إحدى الخدمات المعايير التي تحدّدها، أنشئ سياسة تنبيهات. على سبيل المثال، يمكنك إنشاء سياسة تنبيهات تُعلم فريقك قيد الطلب عندما تتجاوز النسبة المئوية التسعون لمُدد الاستجابة لردود HTTP 200 من خدمتك 100 ملي ثانية.
تمنحك التنبيهات معلومات في الوقت المناسب عن المشاكل في تطبيقات السحابة الإلكترونية حتى تتمكّن من حلّها بسرعة.
تتيح ميزة "مراقبة السحابة الإلكترونية" العديد من أنواع التنبيهات، مثل:
- تنبيهات حدود المقاييس: يمكنك تشغيل تنبيه إذا ارتفع مقياس فوق قيمة معيّنة أو انخفض عنها لفترة زمنية معيّنة أو زاد المقياس أو انخفض بنسبة مئوية محدّدة مسبقًا.
- تنبيهات بشأن الميزانية: يمكنك تفعيل الإشعارات عندما تتجاوز تكاليفك نسبة مئوية من ميزانيتك.
- تنبيهات الحصة: يمكنك تفعيل الإشعارات عند اقتراب معدّل الاستخدام من الحدّ الأقصى للحصة.