เครื่องมือวิเคราะห์และBusiness Intelligence มีความสำคัญอย่างยิ่งต่อการช่วยให้คุณค้นพบข้อมูลเชิงลึกจากข้อมูล BigQuery BigQuery รองรับเครื่องมือการแสดงข้อมูลเป็นภาพหลายอย่างของ Google และบุคคลที่สาม ซึ่งคุณสามารถ ใช้เพื่อวิเคราะห์ผลลัพธ์ของการค้นหาในข้อมูลข้อมูลเชิงลึกเกี่ยวกับสถานที่ได้ ซึ่งรวมถึง
- แท็บการแสดงภาพของ BigQuery Studio
- สมุดบันทึก Colab
- Looker Studio
- Google Earth Engine
- BigQuery Geo Viz
ตัวอย่างด้านล่างอธิบายวิธีแสดงผลลัพธ์ใน
- แท็บการแสดงภาพของ BigQuery Studio ซึ่งเป็นโปรแกรมดูข้อมูลภูมิศาสตร์แบบผสานรวม
- สมุดบันทึก Colab ซึ่งเป็นบริการสมุดบันทึก Jupyter ที่โฮสต์ไว้
- Looker Studio ซึ่งเป็นแพลตฟอร์มที่ให้คุณสร้างและใช้การแสดงข้อมูลเป็นภาพ แดชบอร์ด และรายงาน
- BigQuery Geo Viz ซึ่งเป็นเครื่องมือแสดงภาพข้อมูลภูมิสารสนเทศใน BigQuery โดยใช้ Google Maps API
ตัวอย่างแสดงภาพร้านอาหารที่รองรับวีลแชร์ แต่คุณสามารถแสดงภาพคำค้นหาข้อมูลเชิงลึกเกี่ยวกับสถานที่และคำค้นหาข้อมูลแบรนด์ได้
ดูเอกสารประกอบของ BigQuery เพื่อดูข้อมูลเพิ่มเติมเกี่ยวกับการแสดงข้อมูลเป็นภาพโดยใช้เครื่องมืออื่นๆ
ค้นหาข้อมูลเพื่อแสดงภาพ
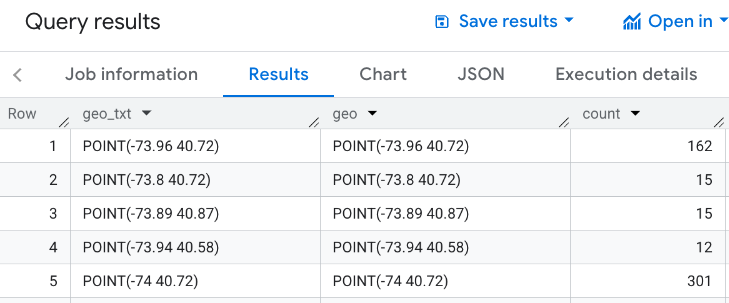
ตัวอย่างการแสดงภาพด้านล่างใช้คำค้นหาต่อไปนี้เพื่อสร้างจำนวน ร้านอาหารที่อยู่ภายในรัศมี 3,000 เมตรจากเอ็มไพร์สเตตในนิวยอร์กซิตี้ ซึ่งมีทางเข้าที่รถเข็นเข้าถึงได้ การค้นหานี้จะแสดงตารางจำนวนร้านอาหารต่อจุดทางภูมิศาสตร์ โดยแต่ละจุดมีขนาด 0.005 องศา
เนื่องจากคุณไม่สามารถดำเนินการ GROUP BY กับจุด GEOGRAPHY ได้ คิวรีนี้จึงใช้ฟังก์ชัน ST_ASTEXT ของ BigQuery
เพื่อแปลงแต่ละจุดเป็นตัวแทน STRING
WKT ของจุด และเขียนค่านั้นลงในคอลัมน์ geo_txt จากนั้นจะดำเนินการ
GROUP BY โดยใช้ geo_txt
SELECT
  geo_txt, -- STRING WKT geometry value.
  ST_GEOGFROMTEXT(geo_txt) AS geo, -- Convert STRING to GEOGRAPHY value.
  count
FROM (
  -- Create STRING WKT representation of each GEOGRAPHY point to
  -- GROUP BY the STRING value.
  SELECT WITH AGGREGATION_THRESHOLD
    ST_ASTEXT(ST_SNAPTOGRID(point, 0.005)) AS geo_txt,
    COUNT(*) AS count
  FROM
    `PROJECT_NAME.places_insights___us.places`
  WHERE
    'restaurant' IN UNNEST(types)
    AND wheelchair_accessible_entrance = true
    AND ST_DWITHIN(ST_GEOGPOINT(-73.9857, 40.7484), point, 3000)
  GROUP BY
    geo_txt
)
รูปภาพต่อไปนี้แสดงเอาต์พุตตัวอย่างสําหรับการค้นหานี้ ซึ่ง count มี
จํานวนร้านอาหารสําหรับแต่ละจุด
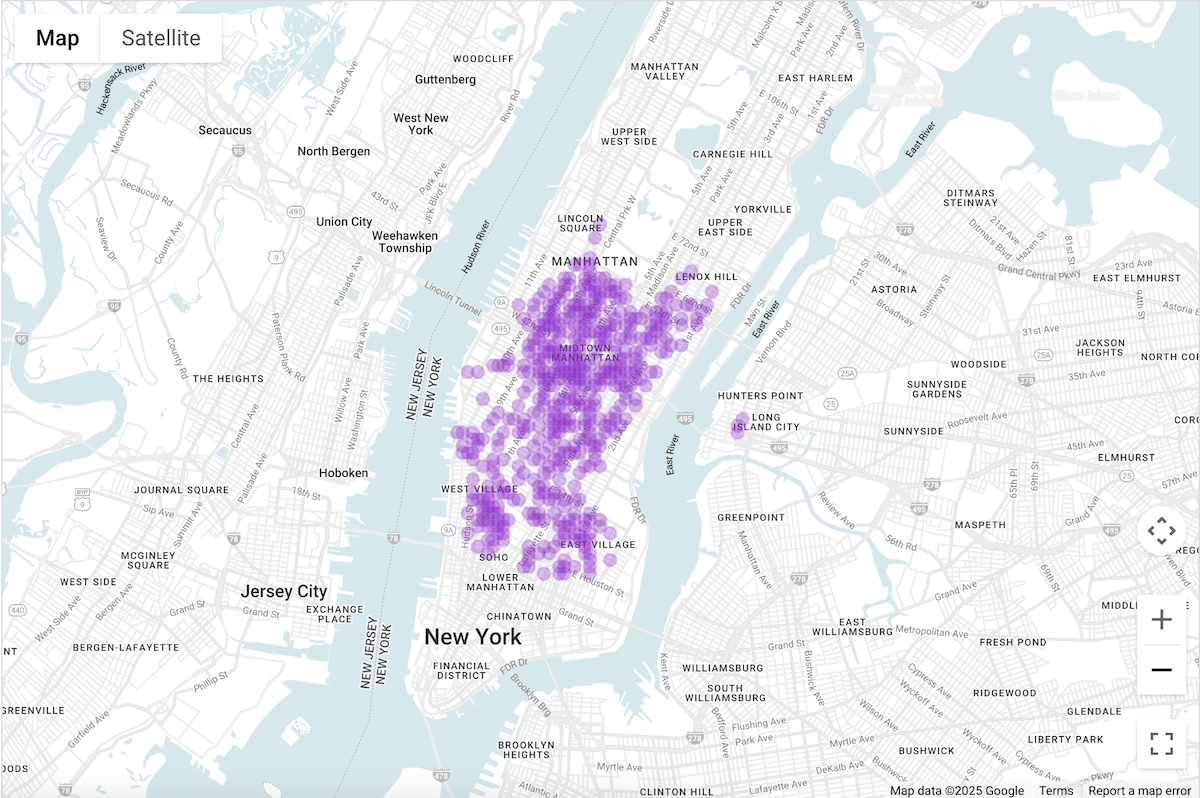
แสดงข้อมูลเป็นภาพโดยใช้แท็บการแสดงภาพของ BigQuery Studio
รูปภาพต่อไปนี้แสดงข้อมูลนี้ใน BigQuery โดยใช้แท็บการแสดงข้อมูล วงกลมสีเข้มกว่าแสดงถึงจำนวนร้านอาหารที่มากกว่าในสถานที่นั้น
แสดงข้อมูลเป็นภาพใน BigQuery Studio
- เรียกใช้การค้นหาด้านบนในค้นหาข้อมูลเพื่อ
แสดงภาพ
- ในผลลัพธ์ BigQuery ให้คลิกแท็บการแสดงข้อมูลด้วยภาพ
- แผนที่จะเปิดขึ้นพร้อมวงกลมที่แสดงจุดที่ค้นหา
ในส่วนการกำหนดค่าการแสดงข้อมูลภาพ ให้ตั้งค่าคอลัมน์ข้อมูลเป็นจำนวน

วงกลมที่เข้มขึ้นจะแสดงจุดที่มีร้านอาหารจำนวนมากกว่า
คุณจะอัปเดตการตั้งค่าอื่นๆ เพื่อเปลี่ยนรูปลักษณ์และความรู้สึกของ ภาพได้หากต้องการ
ไปที่เอกสารประกอบการแสดงข้อมูลด้วยภาพของ BigQuery เพื่อดูข้อมูลเพิ่มเติมเกี่ยวกับตัวเลือกการกำหนดค่า
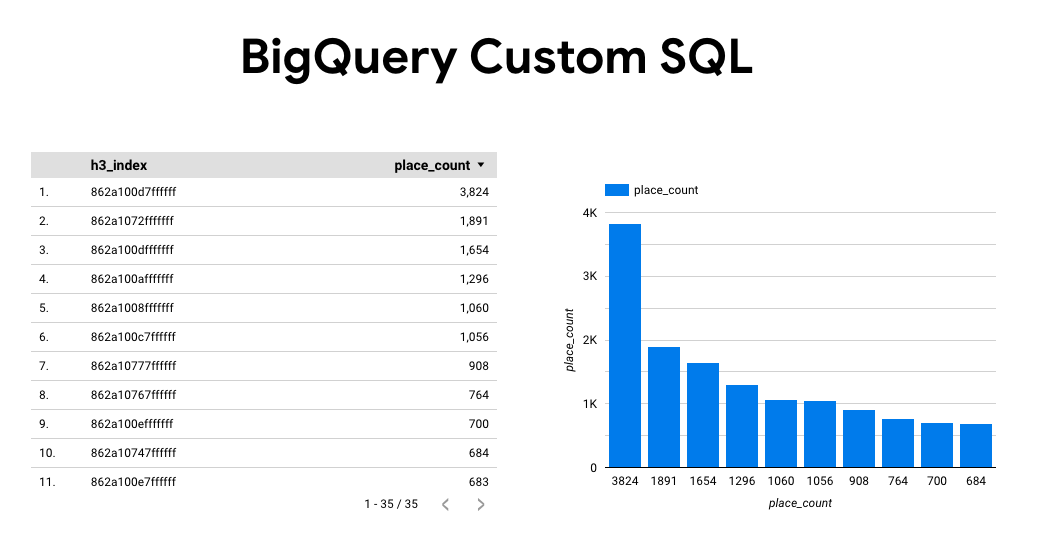
แสดงข้อมูลด้วย Colab Notebook
การแสดงภาพในสมุดบันทึก Colab ช่วยให้คุณควบคุมและปรับแต่งได้มากกว่า BigQuery Studio และช่วยให้คุณอยู่ในสภาพแวดล้อมสมุดบันทึก Jupyter ได้
บทแนะนำเกี่ยวกับการแสดงข้อมูลการวิเคราะห์เชิงพื้นที่ใน Colab มีให้ใน 3 รูปแบบดังนี้
- ในเอกสารประกอบของ Colab
- เป็นวิดีโอ YouTube
- ในสมุดบันทึก GitHub คุณสามารถโคลนและใช้ใน Colab สำหรับ Workspace หรือ Colab Enterprise ได้
บทแนะนำนี้มุ่งเน้นที่แผนภูมิ 4 ประเภทหลักโดยใช้ pydeck, deck.gl และ
- แผนภูมิกระจาย (โดยปกติจะใช้สำหรับการสุ่มตัวอย่าง)
- GeoJSON (สำหรับการค้นพบ)
- โคโรเพลท (สำหรับความเข้ม)
- แผนที่ความหนาแน่น (สำหรับความหนาแน่น)
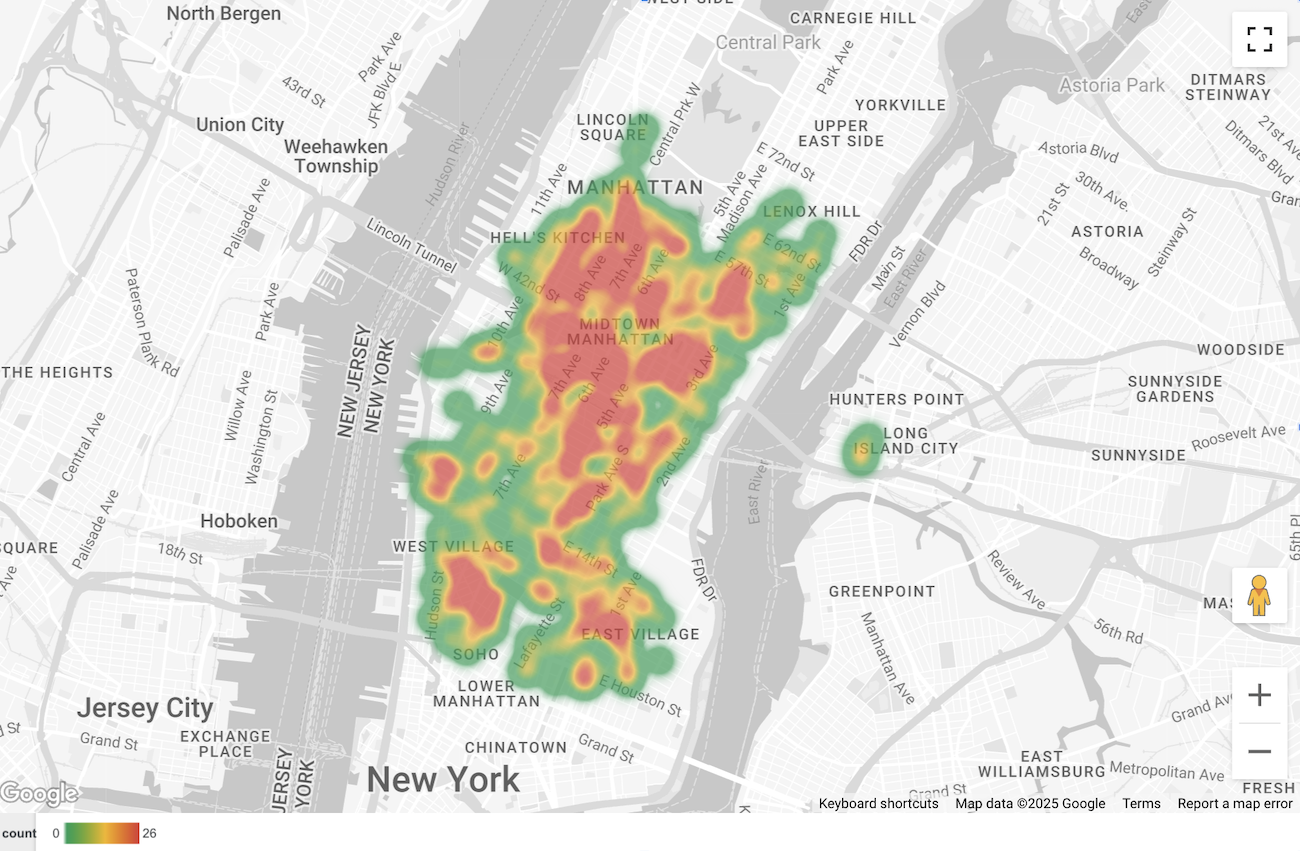
แสดงข้อมูลเป็นภาพโดยใช้ Looker Studio
รูปภาพต่อไปนี้แสดงข้อมูลนี้ที่แสดงใน Looker Studio เป็นแผนที่ความร้อน ฮีตแมปแสดงความหนาแน่นจากต่ำ (สีเขียว) ไปสูง (สีแดง)
นำเข้าข้อมูลไปยัง Looker Studio
วิธีนำเข้าข้อมูลไปยัง Looker Studio
เรียกใช้การค้นหาด้านบนในค้นหาข้อมูลเพื่อแสดงภาพ
ในผลลัพธ์ BigQuery ให้คลิกเปิดใน -> Looker Studio ระบบจะนำเข้าผลลัพธ์ของคุณไปยัง Looker Studio โดยอัตโนมัติ
Looker Studio จะสร้างหน้ารายงานเริ่มต้นและเริ่มต้นด้วยชื่อ ตาราง และกราฟแท่งของผลลัพธ์
เลือกทุกอย่างในหน้าแล้วลบ
คลิกแทรก -> ฮีตแมปเพื่อเพิ่มฮีตแมปลงในรายงาน
ในส่วนประเภทแผนภูมิ -> การตั้งค่า ให้ลากรายการจากส่วนข้อมูลเพื่อ กำหนดค่าช่องตามที่แสดงด้านล่าง
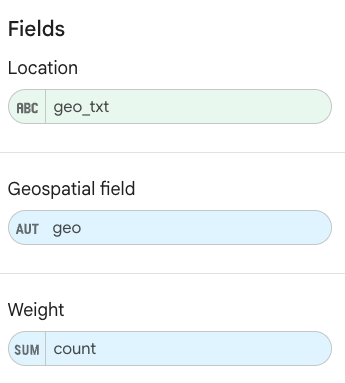
ฮีตแมปจะปรากฏดังที่แสดงด้านบน คุณเลือกประเภทแผนภูมิ -> รูปแบบเพื่อกำหนดค่าลักษณะที่ปรากฏของแผนที่เพิ่มเติมได้ (ไม่บังคับ)
แสดงข้อมูลเป็นภาพโดยใช้ BigQuery Geo Viz
รูปภาพต่อไปนี้แสดงข้อมูลนี้ที่แสดงใน BigQuery Geo Viz เป็นแผนที่แบบเติม แผนที่แบบเติมแสดงความหนาแน่นของร้านอาหารตามเซลล์จุด โดยจุดที่ใหญ่ขึ้น จะสอดคล้องกับความหนาแน่นที่สูงขึ้น
นำเข้าข้อมูลไปยัง BigQuery Geo Viz
วิธีนำเข้าข้อมูลไปยัง BigQuery Geo Viz
เรียกใช้การค้นหาด้านบนในค้นหาข้อมูลเพื่อแสดงภาพ
ในผลลัพธ์ BigQuery ให้คลิกเปิดใน -> GeoViz
จอแสดงผลจะเปิดขึ้นที่ขั้นตอนคำค้นหา
เลือกปุ่มเรียกใช้เพื่อเรียกใช้การค้นหา แผนที่จะแสดง จุดต่างๆ บนแผนที่โดยอัตโนมัติ
เลือกข้อมูลเพื่อดูข้อมูล
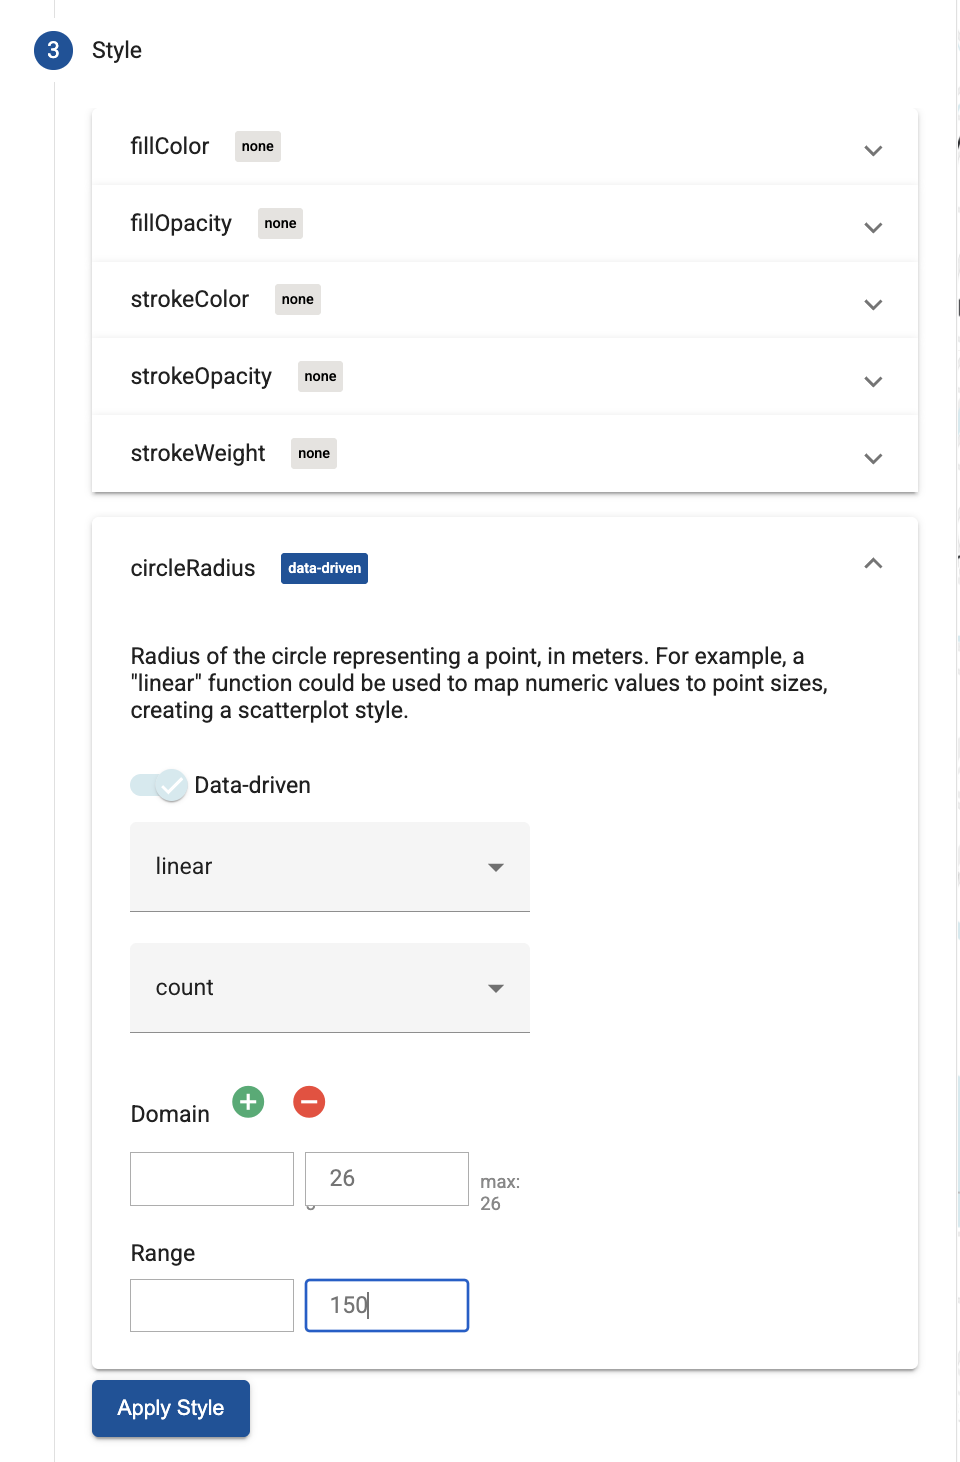
ในส่วนข้อมูล ให้คลิกปุ่มเพิ่มสไตล์
เลือก circleRadius แล้วใช้แถบเลื่อนเพื่อเปิดใช้การจัดรูปแบบอิงตามข้อมูล
ตั้งค่าฟิลด์ที่เหลือดังที่แสดงด้านล่าง
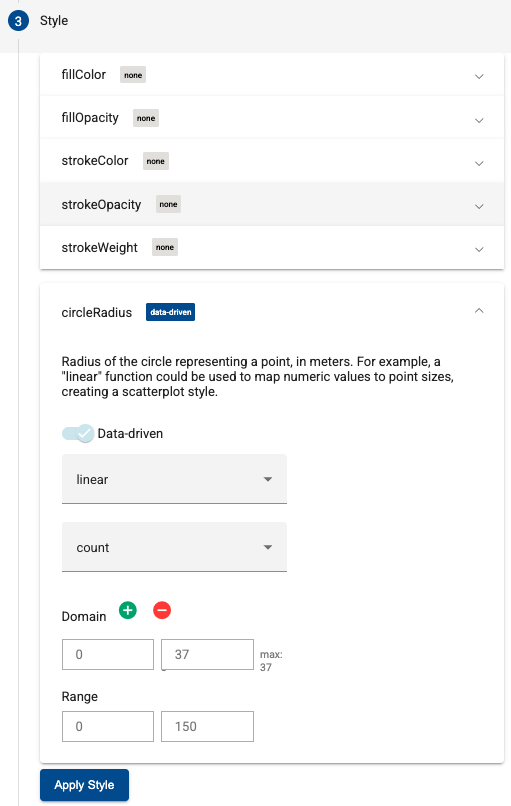
คลิกใช้รูปแบบเพื่อใช้รูปแบบกับแผนที่