تُعدّ أدوات التحليل وذكاء الأعمال ضرورية لمساعدتك في استخلاص الإحصاءات من بياناتك في BigQuery. يتوافق BigQuery مع العديد من أدوات عرض البيانات من Google والجهات الخارجية التي يمكنك استخدامها لتحليل نتائج طلبات البحث في بيانات Places Insights، بما في ذلك:
- علامة التبويب "العرض المرئي" في BigQuery Studio
- أوراق ملاحظات Colab
- Looker Studio
- Google Earth Engine
- BigQuery Geo Viz
توضّح الأمثلة أدناه كيفية عرض نتائجك بصريًا في:
- علامة التبويب "العرض المرئي" في BigQuery Studio، وهي أداة مدمجة لعرض البيانات الجغرافية
- أوراق ملاحظات Colab، وهي خدمة مستضافة على Jupyter Notebook
- Looker Studio هي منصة تتيح لك إنشاء واستخدام التمثيلات البصرية للبيانات ولوحات البيانات والتقارير.
- BigQuery Geo Viz هي أداة لتصوّر البيانات الجغرافية المكانية في BigQuery باستخدام واجهات برمجة التطبيقات في "خرائط Google".
تعرض الأمثلة رسومات بيانية للمطاعم التي يمكن الوصول إليها باستخدام الكراسي المتحركة، ولكن يمكن عرض أي من طلبات البحث في Places Insights وطلبات البحث عن بيانات العلامات التجارية.
راجِع مستندات BigQuery للحصول على مزيد من المعلومات حول عرض بياناتك بشكل مرئي باستخدام أدوات أخرى.
طلب البيانات لعرضها بشكل مرئي
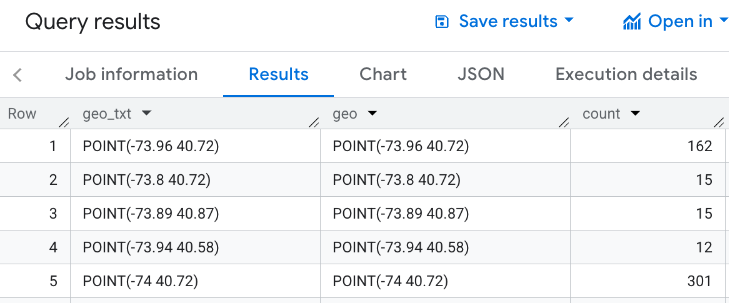
تستخدِم أمثلة التمثيل البصري أدناه طلب البحث التالي لإنشاء عدد المطاعم التي تقع على بُعد 3000 متر من مبنى إمباير ستيت في مدينة نيويورك والتي تتوفّر فيها مداخل مناسبة للكراسي المتحركة. يعرض هذا الطلب جدولاً يتضمّن أعداد المطاعم لكل نقطة جغرافية، حيث يبلغ حجم كل نقطة 0.005 درجة.
بما أنّه لا يمكنك تنفيذ عملية GROUP BY على نقطة GEOGRAPHY، يستخدم طلب البحث هذا الدالة ST_ASTEXT في BigQuery لتحويل كل نقطة إلى تمثيل STRING
WKT للنقطة، ويكتب هذه القيمة في العمود geo_txt. بعد ذلك، ينفّذ GROUP BY باستخدام geo_txt.
SELECT
  geo_txt, -- STRING WKT geometry value.
  ST_GEOGFROMTEXT(geo_txt) AS geo, -- Convert STRING to GEOGRAPHY value.
  count
FROM (
  -- Create STRING WKT representation of each GEOGRAPHY point to
  -- GROUP BY the STRING value.
  SELECT WITH AGGREGATION_THRESHOLD
    ST_ASTEXT(ST_SNAPTOGRID(point, 0.005)) AS geo_txt,
    COUNT(*) AS count
  FROM
    `PROJECT_NAME.places_insights___us.places`
  WHERE
    'restaurant' IN UNNEST(types)
    AND wheelchair_accessible_entrance = true
    AND ST_DWITHIN(ST_GEOGPOINT(-73.9857, 40.7484), point, 3000)
  GROUP BY
    geo_txt
)
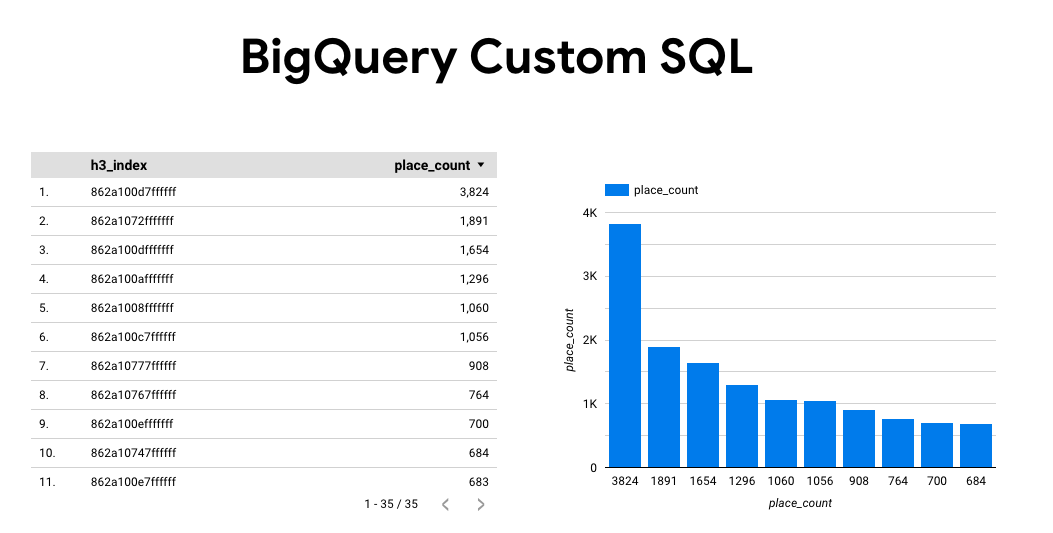
تعرض الصورة التالية مثالاً على الناتج الذي تم الحصول عليه من طلب البحث هذا، حيث يحتوي count على عدد المطاعم لكل نقطة:
عرض البيانات بشكل مرئي باستخدام علامة التبويب "التمثيل البصري" في BigQuery Studio
تعرض الصورة التالية هذه البيانات في BigQuery باستخدام علامة التبويب "التمثيل المرئي". تشير الدوائر الداكنة إلى ارتفاع عدد المطاعم في ذلك الموقع الجغرافي.
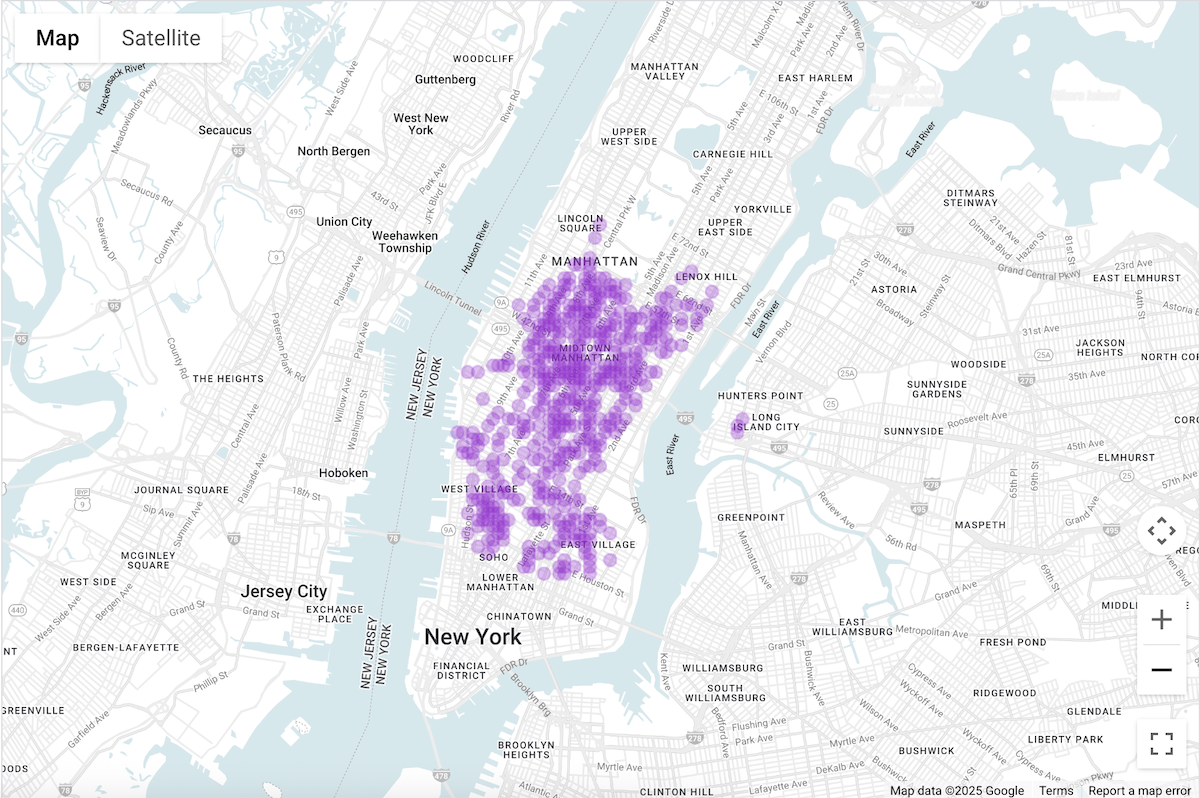
عرض بياناتك بشكل مرئي في BigQuery Studio
- نفِّذ طلب البحث أعلاه في الاستعلام عن البيانات لتصوّرها.
- في نتائج BigQuery، انقر على علامة التبويب تصور.
- سيتم فتح خريطة تحتوي على دوائر تمثّل النقاط التي تم البحث عنها.
ضِمن إعدادات العرض المرئي، اضبط عمود البيانات على عدد.
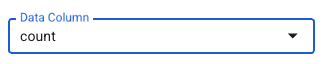
ستشير الدوائر الداكنة إلى النقاط التي تضم عددًا أكبر من المطاعم.
يمكنك اختياريًا تعديل الإعدادات الأخرى لتغيير شكل وطريقة عرض التمثيل المرئي.
يمكنك الانتقال إلى مستندات حول عرض البيانات المرئية في BigQuery للحصول على مزيد من المعلومات حول خيارات الإعداد.
تصوّر البيانات باستخدام "أوراق ملاحظات Colab"
تمنحك ميزة "تصوّر البيانات" في "أوراق ملاحظات Colab" المزيد من التحكّم والدقة مقارنةً بـ BigQuery Studio، كما تتيح لك البقاء في بيئة ورقة ملاحظات Jupyter.
يتوفّر برنامج تعليمي حول عرض بيانات التحليلات الجغرافية المكانية في Colab بثلاثة تنسيقات:
- في مستندات Colab
- فيديو على YouTube
- في ملاحظات GitHub، يمكنك استنساخها واستخدامها في Colab for Workspaces أو Colab Enterprise.
يركّز البرنامج التعليمي على 4 أنواع أساسية من المخططات باستخدام pydeck وdeck.gl و
- مخطّط التبعثر (يُستخدم عادةً لأخذ العيّنات).
- GeoJSON (لإمكانية العثور على المحتوى)
- خريطة توزيعات ذات تظليل مساحي (للكثافة)
- خريطة التمثيل اللوني (للكثافة)
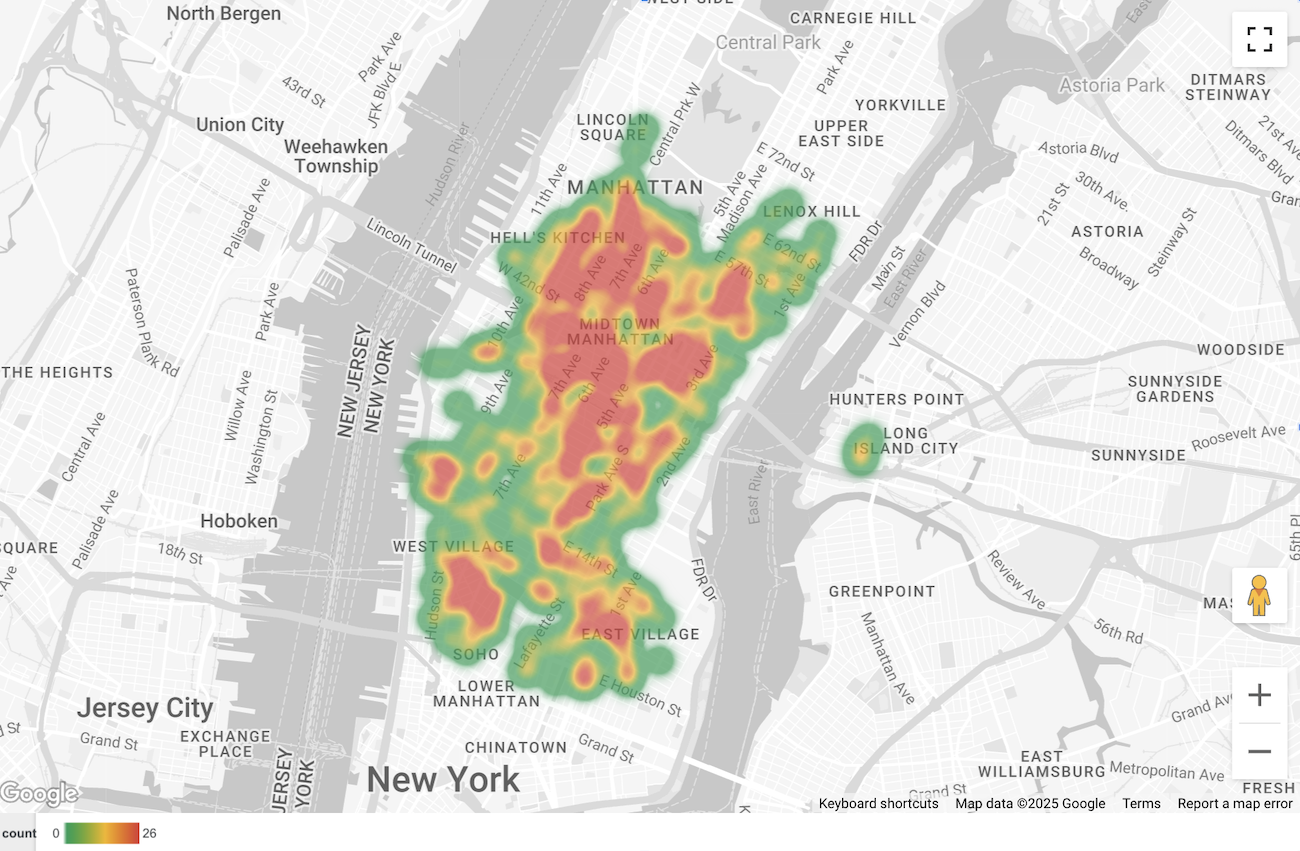
إنشاء عرض مرئي للبيانات باستخدام Looker Studio
تعرض الصور التالية هذه البيانات في Looker Studio كخريطة حرارية. تعرض خريطة الحرارة الكثافة من منخفضة (أخضر) إلى عالية (أحمر).
استيراد بياناتك إلى Looker Studio
لاستيراد بياناتك إلى Looker Studio، اتّبِع الخطوات التالية:
نفِّذ طلب البحث أعلاه في طلب البيانات لتصوّرها.
في نتائج BigQuery، انقر على فتح في -> Looker Studio. يتم تلقائيًا استيراد نتائجك إلى Looker Studio.
تنشئ Looker Studio صفحة تقرير تلقائية وتضبطها باستخدام عنوان وجدول ورسم بياني شريطي للنتائج.
اختَر كل محتوى الصفحة واحذفه.
انقر على إدراج -> خريطة حرارية لإضافة خريطة حرارية إلى تقريرك.
ضِمن أنواع الرسوم البيانية -> الإعداد، اسحب العناصر من قسم البيانات لضبط الحقول كما هو موضّح أدناه:
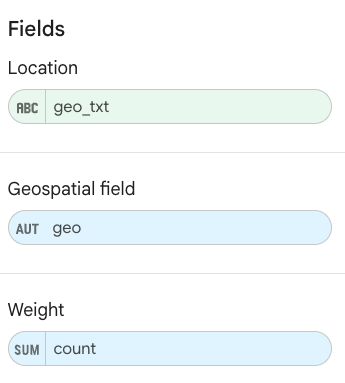
يظهر خريطة الحرارة كما هو موضح أعلاه. يمكنك اختياريًا النقر على أنواع الرسوم البيانية -> الأنماط لضبط مظهر الخريطة بشكلٍ أكبر.
تصوُّر البيانات باستخدام BigQuery Geo Viz
تعرض الصور التالية هذه البيانات في BigQuery Geo Viz كخريطة مملوءة. تعرض الخريطة المعبّأة كثافة المطاعم حسب خلية النقطة، حيث تتوافق النقطة الأكبر مع الكثافة الأعلى.
استيراد بياناتك إلى BigQuery Geo Viz
لاستيراد بياناتك إلى BigQuery Geo Viz، اتّبِع الخطوات التالية:
نفِّذ طلب البحث أعلاه في طلب البيانات لتصوّرها.
في نتائج BigQuery، انقر على فتح في -> GeoViz.
يتم فتح العرض في خطوة طلب البحث.
انقر على الزر تنفيذ لتنفيذ طلب البحث. تعرض الخريطة تلقائيًا النقاط على الخريطة.
انقر على البيانات لعرض البيانات.
في قسم البيانات، انقر على الزر إضافة أنماط.
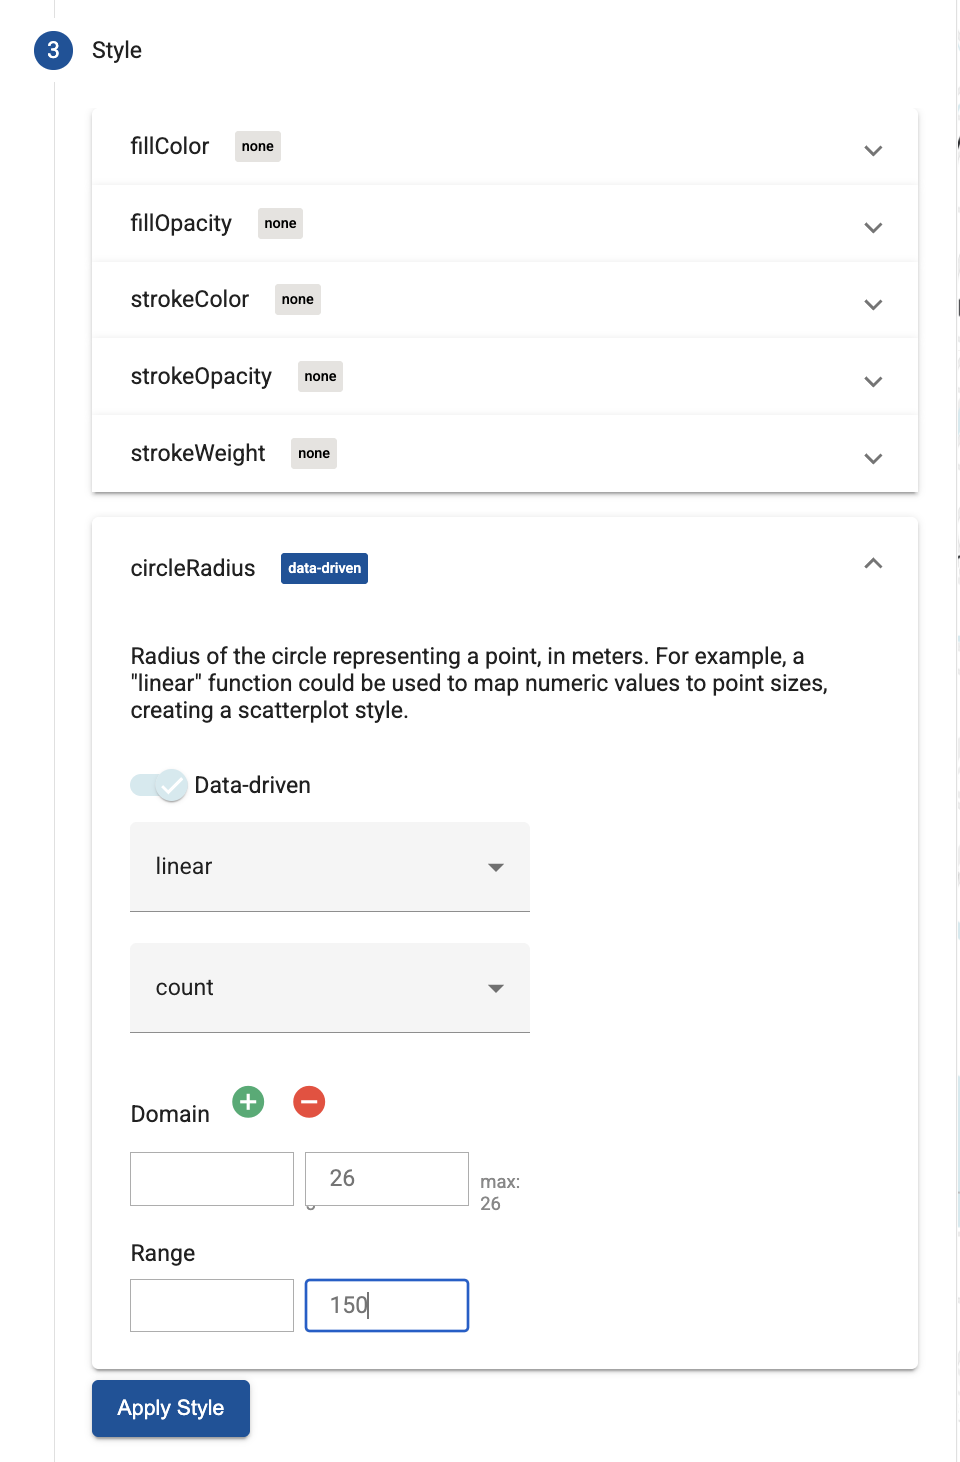
اختَر circleRadius، ثم استخدِم شريط التمرير لتفعيل خيار التصميم المستند إلى البيانات.
اضبط الحقول المتبقية كما هو موضّح أدناه:
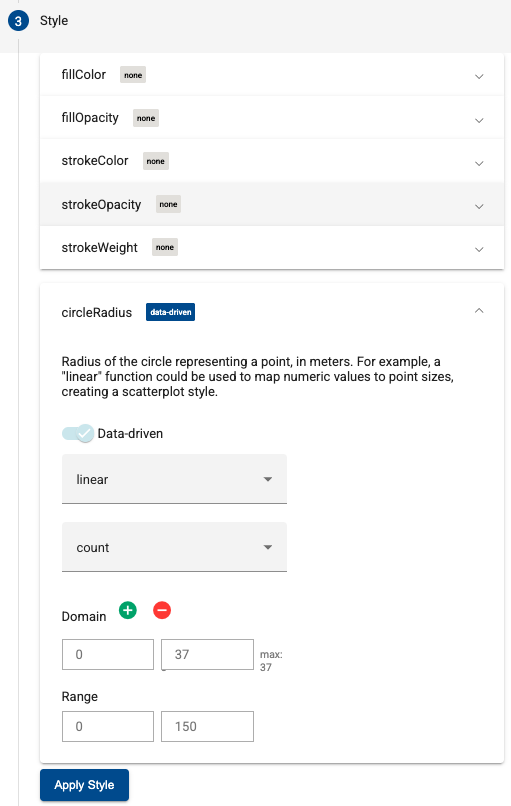
انقر على تطبيق النمط لتطبيق الأنماط على الخريطة.