PLACES_COUNT_PER_GEO ফাংশন অনুসন্ধান করতে ভৌগলিক এলাকার একটি অ্যারে নেয় এবং প্রতি এলাকা প্রতি স্থান গণনার একটি সারণী প্রদান করে। উদাহরণস্বরূপ, যদি আপনি অনুসন্ধান এলাকা হিসাবে জিপ কোডগুলির একটি অ্যারে নির্দিষ্ট করেন, প্রতিক্রিয়াটিতে প্রতিটি জিপ কোডের জন্য একটি পৃথক সারি সহ একটি টেবিল রয়েছে।
কারণ PLACES_COUNT_PER_GEO ফাংশন একটি টেবিল প্রদান করে, এটি একটি FROM ক্লজ ব্যবহার করে কল করুন৷
ইনপুট পরামিতি:
প্রয়োজনীয় :
geographiesফিল্টার প্যারামিটার যা অনুসন্ধান এলাকা নির্দিষ্ট করে।geographiesপ্যারামিটারটি BigQueryGEOGRAPHYডেটা টাইপ দ্বারা সংজ্ঞায়িত মানগুলির একটি অ্যারে নেয়, যা পয়েন্ট, লাইনস্ট্রিং এবং বহুভুজ সমর্থন করে।ঐচ্ছিক : আপনার অনুসন্ধান পরিমার্জিত করার জন্য অতিরিক্ত ফিল্টার পরামিতি।
রিটার্ন:
- ভৌগলিক এলাকা প্রতি এক সারি সহ একটি টেবিল। সারণীতে
geography(GEOGRAPHY),count(INT64), এবংplace_ids(ARRAY<STRING>) রয়েছে যেখানেplace_idsপ্রতিটি ভৌগলিক এলাকার জন্য 250টি পর্যন্ত স্থান আইডি রয়েছে৷
- ভৌগলিক এলাকা প্রতি এক সারি সহ একটি টেবিল। সারণীতে
উদাহরণ: নিউ ইয়র্ক সিটির প্রতিটি কাউন্টিতে রেস্টুরেন্টের সংখ্যা গণনা করুন
এই উদাহরণটি নিউ ইয়র্ক সিটিতে প্রতি কাউন্টিতে কর্মক্ষম রেস্তোরাঁর গণনার একটি সারণী তৈরি করে।
এই উদাহরণটি নিউইয়র্ক সিটির তিনটি কাউন্টির সীমানা পেতে মার্কিন যুক্তরাষ্ট্রের সেন্সাস ব্যুরো ডেটা BigQuery পাবলিক ডেটাসেট ব্যবহার করে: "কুইন্স", "কিংস", "নিউ ইয়র্ক"। প্রতিটি কাউন্টির সীমানা county_geom কলামে রয়েছে।
তারপর এই উদাহরণটি county_geom এর একটি সরলীকৃত সংস্করণ ফেরত দিতে BigQuery ST_SIMPLIFY ফাংশন ব্যবহার করে। ST_SIMPLIFY ফাংশন একটি একক লম্বা প্রান্ত দিয়ে প্রায় সোজা প্রান্তের চেইন প্রতিস্থাপন করে।
DECLARE geos ARRAY<GEOGRAPHY>;

SET geos = (SELECT ARRAY_AGG(ST_SIMPLIFY(county_geom, 100))
            FROM `bigquery-public-data.geo_us_boundaries.counties`
            WHERE county_name IN ("Queens","Kings", "New York") AND state_fips_code = "36");

SELECT * FROM `PROJECT_NAME.places_insights___us.PLACES_COUNT_PER_GEO`(
  JSON_OBJECT(
      'geographies', geos,
      'types', ["restaurant"],
      'business_status', ["OPERATIONAL"]
      )
);
ফাংশনের জন্য প্রতিক্রিয়া:
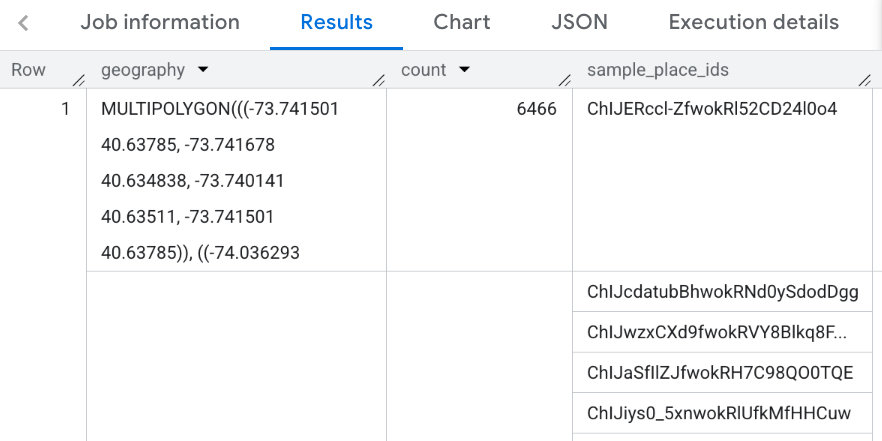
ফলাফল কল্পনা করুন
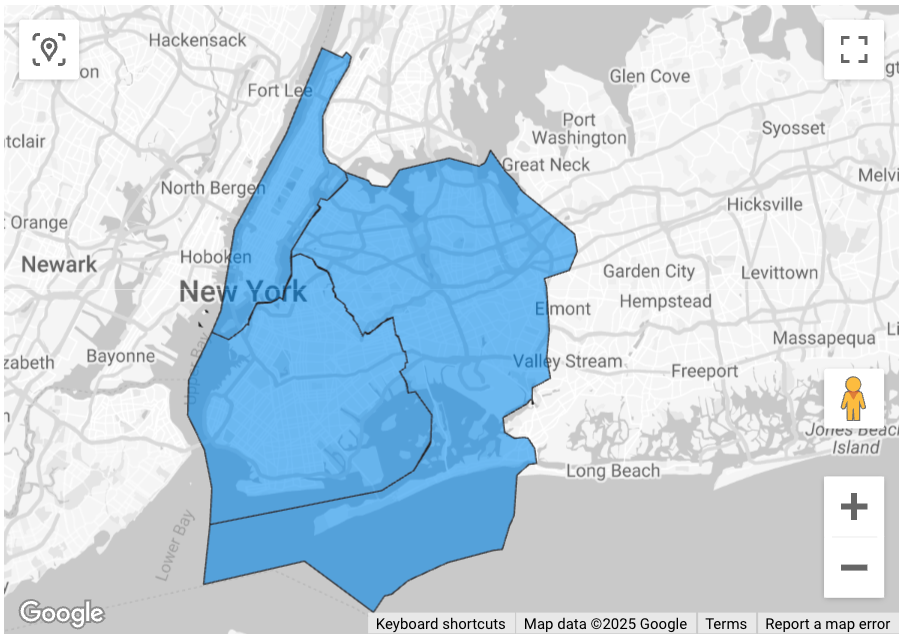
নিম্নলিখিত চিত্রগুলি প্রতিটি কাউন্টির রূপরেখা সহ একটি ভরা মানচিত্র হিসাবে লুকার স্টুডিওতে প্রদর্শিত এই ডেটা দেখায়:
লুকার স্টুডিওতে আপনার ডেটা আমদানি করতে:
ফলাফল তৈরি করতে উপরের ফাংশনটি চালান।
BigQuery ফলাফলে, Open in -> Looker Studio-তে ক্লিক করুন। আপনার ফলাফল স্বয়ংক্রিয়ভাবে লুকার স্টুডিওতে আমদানি করা হয়।
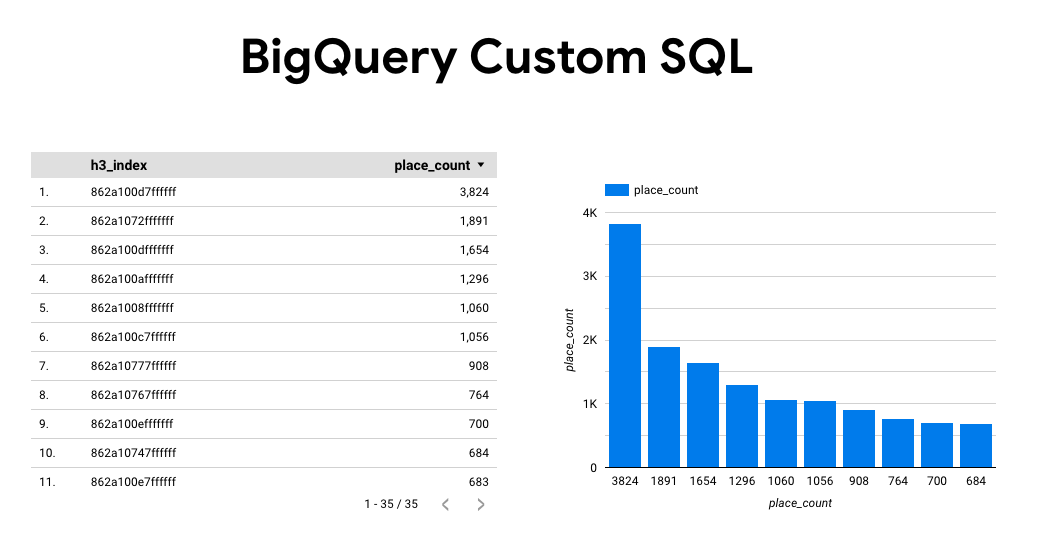
লুকার স্টুডিও একটি ডিফল্ট রিপোর্ট পৃষ্ঠা তৈরি করে এবং ফলাফলের একটি শিরোনাম, টেবিল এবং বার গ্রাফ দিয়ে এটি শুরু করে।
পৃষ্ঠায় সবকিছু নির্বাচন করুন এবং এটি মুছুন।
আপনার রিপোর্টে একটি পূর্ণ মানচিত্র যোগ করতে সন্নিবেশ -> ভরা মানচিত্র ক্লিক করুন।
চার্টের প্রকারের অধীনে -> সেটআপ নীচে দেখানো ক্ষেত্রগুলি কনফিগার করুন::
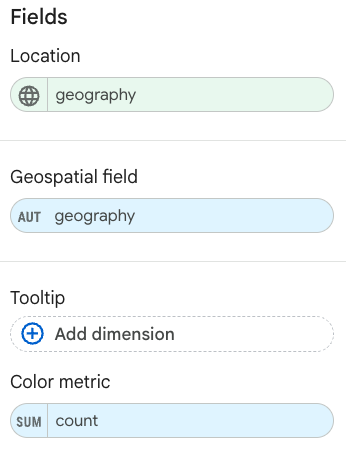
ভরাট মানচিত্র উপরের মত প্রদর্শিত হবে. মানচিত্রের চেহারা আরও কনফিগার করতে আপনি ঐচ্ছিকভাবে চার্ট প্রকার -> শৈলী নির্বাচন করতে পারেন।
স্থানের অন্তর্দৃষ্টি ফলাফলগুলি ভিজ্যুয়ালাইজ করার বিষয়ে আরও তথ্য এবং উদাহরণের জন্য, ক্যোয়ারী ফলাফলগুলি ভিজ্যুয়ালাইজ করুন দেখুন৷