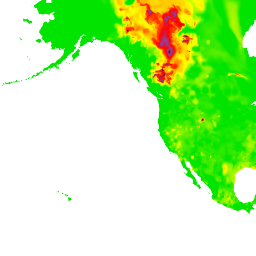
heatmapTiles 端點會透過圖塊疊加層提供空氣品質相關熱視圖。圖塊疊加層是一組 PNG 圖像圖塊,可顯示在 Google 地圖上方。每個圖片圖塊都是 256 x 256 像素。
關於熱視圖方塊
圖塊疊加層是由一組圖塊組成的格線,每個圖塊都已指派 (X,Y) 座標。座標為 (0,0) 的圖塊一律位於地圖的西北角。X 值會從西到東遞增,Y 值則從北到南遞增。
zoom level可決定地圖內容在地圖檢視畫面中的大小。圖塊格線大小取決於將 X 和 Y 座標依縮放等級指數縮放。
gridSizeX = XzoomLevel
gridSizeY = YzoomLevel
舉例來說,縮放等級為 2 時,世界地圖會以 4 x 4 矩陣表示,總共 16 個圖塊。縮放比例也會決定座標允許的最大值。
下圖顯示縮放等級為 2 的 US_AQI 熱度圖,以及每個圖塊的座標:
詳情請參閱「地圖與圖塊座標」。
關於熱視圖端點
熱視圖圖塊是以位元組陣列表示,其中包含 PNG 圖片格式的圖塊資料。您可以使用 heatmapTiles 端點,將 HTTP GET 要求傳送至下列網址,要求取得目前的空氣品質熱度圖圖塊:
https://airquality.googleapis.com/v1/mapTypes/TYPE/heatmapTiles/Z/X/Y?key=YOUR_API_KEY
要求中的所有要求參數皆為必填:
TYPE- 要傳回的熱視圖類型。請參閱允許的值。Z- 縮放等級,決定地圖內容在地圖檢視畫面中的大小。有效值為 0 至 16,值為 0 時,整個世界會顯示在單一圖塊中。X、Y- 要擷取的圖塊座標,以西北角 (0,0) 為基準。X值會從西到東遞增,Y值則從北到南遞增。圖塊座標必須適用於指定的縮放等級。 舉例來說,如果您將縮放等級設為 2,並要求座標為 10,10 的圖塊,API 就會傳回錯誤。
YOUR_API_KEY- 應用程式的 API 金鑰。這個金鑰可識別您的應用程式,以利配額管理。詳情請參閱「取得金鑰」。
熱視圖要求範例
上圖顯示縮放等級為 2 的 US_AQI 熱視圖,以及每個圖塊的座標。下列範例使用 heatmapTiles 端點,從熱度圖要求座標 0,1 的圖塊:
https://airquality.googleapis.com/v1/mapTypes/US_AQI/heatmapTiles/2/0/1?key=YOUR_API_KEY
圖塊會顯示為:

如要進一步瞭解如何在預設地圖上疊加圖塊,請參閱「疊加地圖類型」。

