Zadbaj o dobrą organizację dzięki kolekcji
Zapisuj i kategoryzuj treści zgodnie ze swoimi preferencjami.
Punkt końcowy
heatmapTiles
udostępnia mapy cieplne związane z jakością powietrza w postaci nakładki na kafelki. Nakładka z fragmentami mapy to zbiór fragmentów obrazów PNG, które można wyświetlać na wierzchu Map Google. Każdy fragment obrazu ma wymiary 256 x 256 pikseli.
Informacje o kafelkach mapy termicznej
Nakładka z kafelkami to siatka złożona z kolekcji kafelków, z których każdy ma przypisane współrzędne (X,Y).
Kafelek o współrzędnych (0,0) zawsze znajduje się w północno-zachodnim rogu mapy. Wartości X rosną z zachodu na wschód, a wartości Y – z północy na południe.
zoom level określa, jak duże lub małe będą treści na mapie w widoku mapy. Rozmiar siatki kafelków jest określany przez skalowanie współrzędnych X i Y
wykładniczo według poziomu powiększenia.
gridSizeX = XzoomLevel
gridSizeY = YzoomLevel
Na przykład przy poziomie powiększenia 2 mapa świata jest reprezentowana przez macierz 4 x 4, czyli łącznie 16 kafelków. Powiększenie określa też maksymalną wartość dopuszczalną dla współrzędnych.
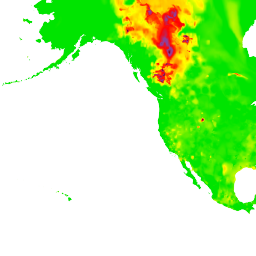
Obraz poniżej przedstawia mapę termiczną US_AQI z poziomem powiększenia 2 oraz współrzędnymi każdego kafelka:
Kafelek mapy termicznej jest reprezentowany przez tablicę bajtów zawierającą dane kafelka w postaci obrazu PNG. Aby poprosić o aktualne kafelki mapy cieplnej jakości powietrza, użyj punktu końcowego heatmapTiles. W tym celu wyślij żądanie HTTP GET na adres:
Z – poziom powiększenia, który określa, jak duże lub małe będą treści mapy w widoku mapy. Dozwolone wartości to 0–16, przy czym wartość 0 wyświetla cały świat na jednym kafelku.
X,Y – współrzędne kafelka do pobrania względem północno-zachodniego rogu (0,0). Wartości X rosną z zachodu na wschód, a wartości Y rosną z północy na południe.
Współrzędne kafelka muszą być prawidłowe dla określonego poziomu powiększenia.
Jeśli na przykład ustawisz poziom powiększenia na 2 i poprosisz o kafelek o współrzędnych 10,10, interfejs API zwróci błąd.
YOUR_API_KEY – klucz interfejsu API aplikacji. Ten klucz identyfikuje Twoją aplikację na potrzeby zarządzania limitami. Więcej informacji znajdziesz w artykule uzyskiwanie klucza.
Przykładowe żądanie mapy termicznej
Obraz powyżej przedstawia US_AQImapę termiczną z poziomem powiększenia 2 oraz współrzędnymi każdego kafelka. W tym przykładzie użyto punktu końcowego heatmapTiles, aby poprosić o kafelek o współrzędnych 0,1 z mapy termicznej:
[[["Łatwo zrozumieć","easyToUnderstand","thumb-up"],["Rozwiązało to mój problem","solvedMyProblem","thumb-up"],["Inne","otherUp","thumb-up"]],[["Brak potrzebnych mi informacji","missingTheInformationINeed","thumb-down"],["Zbyt skomplikowane / zbyt wiele czynności do wykonania","tooComplicatedTooManySteps","thumb-down"],["Nieaktualne treści","outOfDate","thumb-down"],["Problem z tłumaczeniem","translationIssue","thumb-down"],["Problem z przykładami/kodem","samplesCodeIssue","thumb-down"],["Inne","otherDown","thumb-down"]],["Ostatnia aktualizacja: 2025-08-31 UTC."],[[["\u003cp\u003eThe \u003ccode\u003eheatmapTiles\u003c/code\u003e endpoint delivers air quality heatmaps as a tile overlay, which is a collection of PNG images displayed on top of a Google Map.\u003c/p\u003e\n"],["\u003cp\u003eEach tile within the overlay has specific (X, Y) coordinates, with (0,0) at the northwest corner and increasing values eastward (X) and southward (Y), determined by the zoom level.\u003c/p\u003e\n"],["\u003cp\u003eThe zoom level (0-16) controls the map's scale and the tile grid size, with higher zoom levels showing more detailed areas.\u003c/p\u003e\n"],["\u003cp\u003eTo request a heatmap tile, you need to provide the heatmap type, zoom level (Z), tile coordinates (X, Y), and your API key in the request URL.\u003c/p\u003e\n"],["\u003cp\u003eYou can overlay these heatmap tiles on top of the default map using methods described in the provided documentation for a comprehensive air quality visualization.\u003c/p\u003e\n"]]],[],null,["The\n[`heatmapTiles`](/maps/documentation/air-quality/reference/rest/v1/mapTypes.heatmapTiles/lookupHeatmapTile)\nendpoint provides air quality related heatmaps through a tile overlay. A tile\noverlay is a collection of PNG image tiles that can be displayed on top of a\nGoogle Maps. Each image tile is (256 x 256 pixels).\n\nAbout heatmap tiles\n\nThe tile overlay is a grid assembled from a collection of tiles,\neach assigned (`X`,`Y`) coordinates.\nThe tile with coordinates (0,0) is always at the northwest corner\nof the map. The `X` values increase from west to east,\nwhile the `Y` values increase from north to south.\n\nThe `zoom level` determines how large or small the contents of a map appear in a\nmap view. The tile grid size is determined by scaling the `X` and `Y`\ncoordinates exponentially by the zoom level. \n\n```text\ngridSizeX = XzoomLevel\ngridSizeY = YzoomLevel\n```\n\nFor example, at a zoom level of 2, the world map is represented using a 4 x 4\nmatrix, for a total of 16 tiles. The zoom also determines what is the max value\nallowed for the coordinates.\n\nThe following image shows a `US_AQI` heatmap with a zoom level of 2,\nalong with the coordinates of each tile:\n\nSee [Map and Tile coordinates](/maps/documentation/javascript/coordinates)\nfor additional details.\n\nAbout the heatmap endpoint\n\nA heatmap tile is represented by a bytes array containing the tile data as a PNG\nimage. You request current air quality heatmap tiles using the\n[`heatmapTiles`](/maps/documentation/air-quality/reference/rest/v1/mapTypes.heatmapTiles/lookupHeatmapTile)\nendpoint by sending an HTTP GET request to: \n\n```html\nhttps://airquality.googleapis.com/v1/mapTypes/TYPE/heatmapTiles/Z/X/Y?key=YOUR_API_KEY\n```\n\nAll request parameters are required in a request:\n\n- `TYPE` - The type heatmap to return. See [allowed\n values](/maps/documentation/air-quality/reference/rest/v1/mapTypes.heatmapTiles/lookupHeatmapTile#maptype).\n\n- `Z` - Zoom level that determines how large or small the contents of a map\n appear in a map view. Allowed values are 0-16, where a value of 0 displays\n the entire world in a single tile.\n\n- `X`,`Y` - The coordinates of the tile to retrieve, relative to the north\n west corner (0,0). `X` values are increasing from west to east and `Y`\n values are increasing from north to south.\n\n Tile coordinates have to be valid for the specified zoom level.\n For example, if you set the zoom level to 2, and request a tile at\n coordinates of 10,10, the API returns an error.\n- `YOUR_API_KEY` - Your application's API key. This key identifies your\n application for purposes of quota management. For more information, see [get\n a key](/maps/documentation/air-quality/get-api-key).\n\nExample heatmap request\n\nThe image above shows a `US_AQI` heatmap with a zoom level of 2,\nalong with the coordinates of each tile. The following example uses the\n`heatmapTiles` endpoint to request the tile at coordinates 0,1 from the\nheatmap: \n\n```html\nhttps://airquality.googleapis.com/v1/mapTypes/US_AQI/heatmapTiles/2/0/1?key=YOUR_API_KEY\n```\n\nThe tile appears as:\n\nFor more information on overlaying tiles on top of the default map, see\n[Overlay Map Types](/maps/documentation/javascript/examples/maptype-overlay)."]]