קל לארגן דפים בעזרת אוספים
אפשר לשמור ולסווג תוכן על סמך ההעדפות שלך.
נקודת הקצה
heatmapTiles
מספקת מפות חום שקשורות לאיכות האוויר באמצעות שכבת-על של משבצות. שכבת-על של משבצות היא אוסף של משבצות תמונה בפורמט PNG שאפשר להציג מעל מפות Google. כל משבצת תמונה היא בגודל (256 x 256 פיקסלים).
מידע על אריחים של מפות חום
שכבת העל של קטעי המפה היא רשת שמורכבת מאוסף של קטעי מפה, שלכל אחד מהם מוקצות קואורדינטות (X,Y).
האריח עם הקואורדינטות (0,0) תמיד נמצא בפינה הצפון-מערבית של המפה. הערכים של X עולים ממערב למזרח, והערכים של Y עולים מצפון לדרום.
ההגדרה zoom level קובעת את הגודל שבו התוכן של המפה יופיע בתצוגת המפה. גודל רשת המשבצות נקבע על ידי שינוי קנה המידה של הקואורדינטות X ו-Y באופן אקספוננציאלי לפי רמת הזום.
gridSizeX = XzoomLevel
gridSizeY = YzoomLevel
לדוגמה, ברמת זום של 2, מפת העולם מיוצגת באמצעות מטריצה בגודל 4x4, כלומר 16 משבצות. הזום גם קובע מהו הערך המקסימלי המותר לקואורדינטות.
בתמונה הבאה מוצג US_AQI מפת חום ברמת זום של 2, לצד הקואורדינטות של כל משבצת:
משבצת של מפת חום מיוצגת על ידי מערך בייטים שמכיל את נתוני המשבצת כתמונה בפורמט PNG. כדי לבקש משבצות של מפת חום של איכות האוויר הנוכחית, שולחים בקשת HTTP GET לנקודת הקצה heatmapTiles:
Z – רמת הזום שקובעת את הגודל שבו התוכן של המפה מוצג בתצוגת המפה. הערכים המותרים הם 0-16, כאשר ערך של 0 מציג את כל העולם במשבצת אחת.
X,Y – הקואורדינטות של המשבצת לאחזור, ביחס לפינה הצפון-מערבית (0,0). הערכים של X עולים ממערב למזרח, והערכים של Y עולים מצפון לדרום.
הקואורדינטות של המשבצת צריכות להיות תקינות לרמת הזום שצוינה.
לדוגמה, אם מגדירים את רמת הזום ל-2 ומבקשים משבצת בקואורדינטות 10,10, ה-API מחזיר שגיאה.
YOUR_API_KEY – מפתח ה-API של האפליקציה. המפתח הזה מזהה את האפליקציה שלכם לצורך ניהול המכסה. מידע נוסף זמין במאמר קבלת מפתח.
דוגמה לבקשה של מפת חום
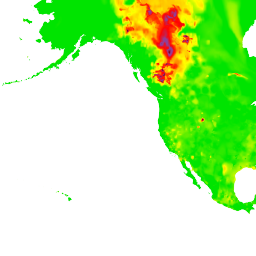
בתמונה שלמעלה מוצג US_AQIמפת חום עם רמת זום של 2, וגם הקואורדינטות של כל משבצת. בדוגמה הבאה נעשה שימוש בנקודת הקצה heatmapTiles כדי לבקש את המשבצת בקואורדינטות 0,1 ממפת החום:
[[["התוכן קל להבנה","easyToUnderstand","thumb-up"],["התוכן עזר לי לפתור בעיה","solvedMyProblem","thumb-up"],["סיבה אחרת","otherUp","thumb-up"]],[["חסרים לי מידע או פרטים","missingTheInformationINeed","thumb-down"],["התוכן מורכב מדי או עם יותר מדי שלבים","tooComplicatedTooManySteps","thumb-down"],["התוכן לא עדכני","outOfDate","thumb-down"],["בעיה בתרגום","translationIssue","thumb-down"],["בעיה בדוגמאות/בקוד","samplesCodeIssue","thumb-down"],["סיבה אחרת","otherDown","thumb-down"]],["עדכון אחרון: 2025-08-31 (שעון UTC)."],[[["\u003cp\u003eThe \u003ccode\u003eheatmapTiles\u003c/code\u003e endpoint delivers air quality heatmaps as a tile overlay, which is a collection of PNG images displayed on top of a Google Map.\u003c/p\u003e\n"],["\u003cp\u003eEach tile within the overlay has specific (X, Y) coordinates, with (0,0) at the northwest corner and increasing values eastward (X) and southward (Y), determined by the zoom level.\u003c/p\u003e\n"],["\u003cp\u003eThe zoom level (0-16) controls the map's scale and the tile grid size, with higher zoom levels showing more detailed areas.\u003c/p\u003e\n"],["\u003cp\u003eTo request a heatmap tile, you need to provide the heatmap type, zoom level (Z), tile coordinates (X, Y), and your API key in the request URL.\u003c/p\u003e\n"],["\u003cp\u003eYou can overlay these heatmap tiles on top of the default map using methods described in the provided documentation for a comprehensive air quality visualization.\u003c/p\u003e\n"]]],[],null,["The\n[`heatmapTiles`](/maps/documentation/air-quality/reference/rest/v1/mapTypes.heatmapTiles/lookupHeatmapTile)\nendpoint provides air quality related heatmaps through a tile overlay. A tile\noverlay is a collection of PNG image tiles that can be displayed on top of a\nGoogle Maps. Each image tile is (256 x 256 pixels).\n\nAbout heatmap tiles\n\nThe tile overlay is a grid assembled from a collection of tiles,\neach assigned (`X`,`Y`) coordinates.\nThe tile with coordinates (0,0) is always at the northwest corner\nof the map. The `X` values increase from west to east,\nwhile the `Y` values increase from north to south.\n\nThe `zoom level` determines how large or small the contents of a map appear in a\nmap view. The tile grid size is determined by scaling the `X` and `Y`\ncoordinates exponentially by the zoom level. \n\n```text\ngridSizeX = XzoomLevel\ngridSizeY = YzoomLevel\n```\n\nFor example, at a zoom level of 2, the world map is represented using a 4 x 4\nmatrix, for a total of 16 tiles. The zoom also determines what is the max value\nallowed for the coordinates.\n\nThe following image shows a `US_AQI` heatmap with a zoom level of 2,\nalong with the coordinates of each tile:\n\nSee [Map and Tile coordinates](/maps/documentation/javascript/coordinates)\nfor additional details.\n\nAbout the heatmap endpoint\n\nA heatmap tile is represented by a bytes array containing the tile data as a PNG\nimage. You request current air quality heatmap tiles using the\n[`heatmapTiles`](/maps/documentation/air-quality/reference/rest/v1/mapTypes.heatmapTiles/lookupHeatmapTile)\nendpoint by sending an HTTP GET request to: \n\n```html\nhttps://airquality.googleapis.com/v1/mapTypes/TYPE/heatmapTiles/Z/X/Y?key=YOUR_API_KEY\n```\n\nAll request parameters are required in a request:\n\n- `TYPE` - The type heatmap to return. See [allowed\n values](/maps/documentation/air-quality/reference/rest/v1/mapTypes.heatmapTiles/lookupHeatmapTile#maptype).\n\n- `Z` - Zoom level that determines how large or small the contents of a map\n appear in a map view. Allowed values are 0-16, where a value of 0 displays\n the entire world in a single tile.\n\n- `X`,`Y` - The coordinates of the tile to retrieve, relative to the north\n west corner (0,0). `X` values are increasing from west to east and `Y`\n values are increasing from north to south.\n\n Tile coordinates have to be valid for the specified zoom level.\n For example, if you set the zoom level to 2, and request a tile at\n coordinates of 10,10, the API returns an error.\n- `YOUR_API_KEY` - Your application's API key. This key identifies your\n application for purposes of quota management. For more information, see [get\n a key](/maps/documentation/air-quality/get-api-key).\n\nExample heatmap request\n\nThe image above shows a `US_AQI` heatmap with a zoom level of 2,\nalong with the coordinates of each tile. The following example uses the\n`heatmapTiles` endpoint to request the tile at coordinates 0,1 from the\nheatmap: \n\n```html\nhttps://airquality.googleapis.com/v1/mapTypes/US_AQI/heatmapTiles/2/0/1?key=YOUR_API_KEY\n```\n\nThe tile appears as:\n\nFor more information on overlaying tiles on top of the default map, see\n[Overlay Map Types](/maps/documentation/javascript/examples/maptype-overlay)."]]