Mit Sammlungen den Überblick behalten
Sie können Inhalte basierend auf Ihren Einstellungen speichern und kategorisieren.
Der Endpunkt heatmapTiles stellt Heatmaps zur Luftqualität über ein Kachel-Overlay bereit. Ein Kachel-Overlay ist eine Sammlung von PNG-Bildkacheln, die über Google Maps angezeigt werden können. Jede Bildkachel hat eine Größe von 256 × 256 Pixeln.
Heatmap-Kacheln
Das Kachel-Overlay ist ein Raster, das aus einer Sammlung von Kacheln besteht, denen jeweils (X,Y)-Koordinaten zugewiesen sind.
Die Kachel mit den Koordinaten (0,0) befindet sich immer in der nordwestlichen Ecke der Karte. Die X-Werte nehmen von Westen nach Osten und die Y-Werte von Norden nach Süden zu.
Mit dem zoom level wird festgelegt, wie groß oder klein die Inhalte einer Karte in einer Kartenansicht dargestellt werden. Die Größe des Kachelraster wird durch exponentielles Skalieren der X- und Y-Koordinaten mit der Zoomstufe bestimmt.
gridSizeX = XzoomLevel
gridSizeY = YzoomLevel
Bei Zoomstufe 2 wird die Weltkarte beispielsweise mit einer 4 × 4-Matrix dargestellt, also mit insgesamt 16 Kacheln. Der Zoom bestimmt auch den maximal zulässigen Wert für die Koordinaten.
Das folgende Bild zeigt eine US_AQI-Heatmap mit einer Zoomstufe von 2 sowie die Koordinaten der einzelnen Kacheln:
Eine Heatmap-Kachel wird durch ein Byte-Array dargestellt, das die Kacheldaten als PNG-Bild enthält. Sie können aktuelle Heatmap-Kacheln zur Luftqualität über den Endpunkt heatmapTiles anfordern, indem Sie eine HTTP-GET-Anfrage an folgende Adresse senden:
Alle Anfrageparameter sind in einer Anfrage erforderlich:
TYPE: Der zurückzugebende Heatmap-Typ. Weitere Informationen finden Sie unter Zulässige Werte.
Z: Zoomstufe, die bestimmt, wie groß oder klein der Inhalt einer Karte in einer Kartenansicht dargestellt wird. Zulässige Werte sind 0–16. Bei einem Wert von 0 wird die gesamte Welt in einer einzigen Kachel dargestellt.
X,Y: Die Koordinaten der abzurufenden Kachel relativ zur nordwestlichen Ecke (0,0). Die X-Werte nehmen von Westen nach Osten und die Y-Werte von Norden nach Süden zu.
Kachelkoordinaten müssen für die angegebene Zoomstufe gültig sein.
Wenn Sie beispielsweise die Zoomstufe auf 2 festlegen und eine Kachel mit den Koordinaten 10,10 anfordern, gibt die API einen Fehler zurück.
YOUR_API_KEY: Der API-Schlüssel Ihrer Anwendung. Mit diesem Schlüssel wird Ihre Anwendung für die Kontingentverwaltung identifiziert. Weitere Informationen finden Sie unter Schlüssel abrufen.
Beispiel für eine Heatmap-Anfrage
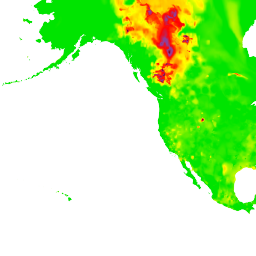
Das Bild oben zeigt eine US_AQI-Heatmap mit einem Zoomfaktor von 2 sowie die Koordinaten der einzelnen Kacheln. Im folgenden Beispiel wird der heatmapTiles-Endpunkt verwendet, um die Kachel mit den Koordinaten 0,1 aus der Heatmap anzufordern:
[[["Leicht verständlich","easyToUnderstand","thumb-up"],["Mein Problem wurde gelöst","solvedMyProblem","thumb-up"],["Sonstiges","otherUp","thumb-up"]],[["Benötigte Informationen nicht gefunden","missingTheInformationINeed","thumb-down"],["Zu umständlich/zu viele Schritte","tooComplicatedTooManySteps","thumb-down"],["Nicht mehr aktuell","outOfDate","thumb-down"],["Problem mit der Übersetzung","translationIssue","thumb-down"],["Problem mit Beispielen/Code","samplesCodeIssue","thumb-down"],["Sonstiges","otherDown","thumb-down"]],["Zuletzt aktualisiert: 2025-08-31 (UTC)."],[[["\u003cp\u003eThe \u003ccode\u003eheatmapTiles\u003c/code\u003e endpoint delivers air quality heatmaps as a tile overlay, which is a collection of PNG images displayed on top of a Google Map.\u003c/p\u003e\n"],["\u003cp\u003eEach tile within the overlay has specific (X, Y) coordinates, with (0,0) at the northwest corner and increasing values eastward (X) and southward (Y), determined by the zoom level.\u003c/p\u003e\n"],["\u003cp\u003eThe zoom level (0-16) controls the map's scale and the tile grid size, with higher zoom levels showing more detailed areas.\u003c/p\u003e\n"],["\u003cp\u003eTo request a heatmap tile, you need to provide the heatmap type, zoom level (Z), tile coordinates (X, Y), and your API key in the request URL.\u003c/p\u003e\n"],["\u003cp\u003eYou can overlay these heatmap tiles on top of the default map using methods described in the provided documentation for a comprehensive air quality visualization.\u003c/p\u003e\n"]]],[],null,["The\n[`heatmapTiles`](/maps/documentation/air-quality/reference/rest/v1/mapTypes.heatmapTiles/lookupHeatmapTile)\nendpoint provides air quality related heatmaps through a tile overlay. A tile\noverlay is a collection of PNG image tiles that can be displayed on top of a\nGoogle Maps. Each image tile is (256 x 256 pixels).\n\nAbout heatmap tiles\n\nThe tile overlay is a grid assembled from a collection of tiles,\neach assigned (`X`,`Y`) coordinates.\nThe tile with coordinates (0,0) is always at the northwest corner\nof the map. The `X` values increase from west to east,\nwhile the `Y` values increase from north to south.\n\nThe `zoom level` determines how large or small the contents of a map appear in a\nmap view. The tile grid size is determined by scaling the `X` and `Y`\ncoordinates exponentially by the zoom level. \n\n```text\ngridSizeX = XzoomLevel\ngridSizeY = YzoomLevel\n```\n\nFor example, at a zoom level of 2, the world map is represented using a 4 x 4\nmatrix, for a total of 16 tiles. The zoom also determines what is the max value\nallowed for the coordinates.\n\nThe following image shows a `US_AQI` heatmap with a zoom level of 2,\nalong with the coordinates of each tile:\n\nSee [Map and Tile coordinates](/maps/documentation/javascript/coordinates)\nfor additional details.\n\nAbout the heatmap endpoint\n\nA heatmap tile is represented by a bytes array containing the tile data as a PNG\nimage. You request current air quality heatmap tiles using the\n[`heatmapTiles`](/maps/documentation/air-quality/reference/rest/v1/mapTypes.heatmapTiles/lookupHeatmapTile)\nendpoint by sending an HTTP GET request to: \n\n```html\nhttps://airquality.googleapis.com/v1/mapTypes/TYPE/heatmapTiles/Z/X/Y?key=YOUR_API_KEY\n```\n\nAll request parameters are required in a request:\n\n- `TYPE` - The type heatmap to return. See [allowed\n values](/maps/documentation/air-quality/reference/rest/v1/mapTypes.heatmapTiles/lookupHeatmapTile#maptype).\n\n- `Z` - Zoom level that determines how large or small the contents of a map\n appear in a map view. Allowed values are 0-16, where a value of 0 displays\n the entire world in a single tile.\n\n- `X`,`Y` - The coordinates of the tile to retrieve, relative to the north\n west corner (0,0). `X` values are increasing from west to east and `Y`\n values are increasing from north to south.\n\n Tile coordinates have to be valid for the specified zoom level.\n For example, if you set the zoom level to 2, and request a tile at\n coordinates of 10,10, the API returns an error.\n- `YOUR_API_KEY` - Your application's API key. This key identifies your\n application for purposes of quota management. For more information, see [get\n a key](/maps/documentation/air-quality/get-api-key).\n\nExample heatmap request\n\nThe image above shows a `US_AQI` heatmap with a zoom level of 2,\nalong with the coordinates of each tile. The following example uses the\n`heatmapTiles` endpoint to request the tile at coordinates 0,1 from the\nheatmap: \n\n```html\nhttps://airquality.googleapis.com/v1/mapTypes/US_AQI/heatmapTiles/2/0/1?key=YOUR_API_KEY\n```\n\nThe tile appears as:\n\nFor more information on overlaying tiles on top of the default map, see\n[Overlay Map Types](/maps/documentation/javascript/examples/maptype-overlay)."]]