تنظيم صفحاتك في مجموعات
يمكنك حفظ المحتوى وتصنيفه حسب إعداداتك المفضّلة.
تقدّم نقطة النهاية
heatmapTiles
خرائط حرارية ذات صلة بجودة الهواء من خلال طبقة مربّعات متراكبة. تراكب المربّعات هو مجموعة من مربّعات صور PNG يمكن عرضها فوق "خرائط Google". يبلغ حجم كل مربّع صورة (256 × 256 بكسل).
لمحة عن مربّعات خريطة التمثيل اللوني
تراكب الصور هو شبكة مجمّعة من مجموعة من الصور،
يتم تعيين إحداثيات (X،Y) لكل صورة.
يقع المربع الذي يتضمّن الإحداثيات (0,0) دائمًا في الزاوية الشمالية الغربية من الخريطة. تزداد قيم X من الغرب إلى الشرق، بينما تزداد قيم Y من الشمال إلى الجنوب.
يحدّد zoom level حجم المحتوى الذي يظهر في عرض الخريطة. يتم تحديد حجم شبكة المربّعات من خلال تغيير مقياس الإحداثيات X وY
بشكل أُسّي حسب مستوى التكبير/التصغير.
gridSizeX = XzoomLevel
gridSizeY = YzoomLevel
على سبيل المثال، عند مستوى تكبير/تصغير 2، يتم تمثيل خريطة العالم باستخدام مصفوفة 4 × 4، أي ما مجموعه 16 مربّعًا. يحدّد مستوى التكبير/التصغير أيضًا الحد الأقصى للقيمة المسموح بها للإحداثيات.
تعرض الصورة التالية US_AQI خريطة حرارية بمستوى تكبير/تصغير يبلغ 2، بالإضافة إلى إحداثيات كل مربّع:
يتم تمثيل مربّع خريطة التمثيل اللوني بمصفوفة بايتات تحتوي على بيانات المربّع كصورة بتنسيق PNG. يمكنك طلب مربّعات خريطة الحرارة الحالية لجودة الهواء باستخدام نقطة النهاية
heatmapTiles
من خلال إرسال طلب HTTP GET إلى:
TYPE: تمثّل هذه السمة نوع خريطة الحرارة المطلوب عرضها. يُرجى الاطّلاع على القيم المسموح بها.
Z: مستوى التكبير أو التصغير الذي يحدّد حجم محتوى الخريطة في عرض الخريطة تتراوح القيم المسموح بها بين 0 و16، حيث تعرض القيمة 0 العالم بأسره في مربّع واحد.
X,Y - إحداثيات المربّع المطلوب استرداده، نسبةً إلى الزاوية الشمالية الغربية (0,0). تزداد قيم X من الغرب إلى الشرق، وتزداد قيم Y من الشمال إلى الجنوب.
يجب أن تكون إحداثيات المربّعات صالحة لمستوى التكبير أو التصغير المحدّد.
على سبيل المثال، إذا ضبطت مستوى التكبير/التصغير على 2 وطلبت مربّعًا في الإحداثيات 10 و10، ستعرض واجهة برمجة التطبيقات رسالة خطأ.
YOUR_API_KEY: مفتاح واجهة برمجة التطبيقات لتطبيقك. يحدّد هذا المفتاح تطبيقك لأغراض إدارة الحصة. لمزيد من المعلومات، يُرجى الاطّلاع على الحصول على مفتاح.
مثال على طلب خريطة التمثيل اللوني
تعرض الصورة أعلاه خريطة حرارية US_AQI بمستوى تكبير يبلغ 2،
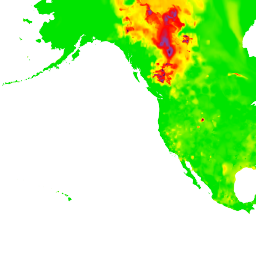
بالإضافة إلى إحداثيات كل مربّع. يستخدم المثال التالي نقطة النهاية heatmapTiles لطلب المربّع في الإحداثيات 0,1 من خريطة الكثافة:
تاريخ التعديل الأخير: 2025-08-31 (حسب التوقيت العالمي المتفَّق عليه)
[[["يسهُل فهم المحتوى.","easyToUnderstand","thumb-up"],["ساعَدني المحتوى في حلّ مشكلتي.","solvedMyProblem","thumb-up"],["غير ذلك","otherUp","thumb-up"]],[["لا يحتوي على المعلومات التي أحتاج إليها.","missingTheInformationINeed","thumb-down"],["الخطوات معقدة للغاية / كثيرة جدًا.","tooComplicatedTooManySteps","thumb-down"],["المحتوى قديم.","outOfDate","thumb-down"],["ثمة مشكلة في الترجمة.","translationIssue","thumb-down"],["مشكلة في العيّنات / التعليمات البرمجية","samplesCodeIssue","thumb-down"],["غير ذلك","otherDown","thumb-down"]],["تاريخ التعديل الأخير: 2025-08-31 (حسب التوقيت العالمي المتفَّق عليه)"],[[["\u003cp\u003eThe \u003ccode\u003eheatmapTiles\u003c/code\u003e endpoint delivers air quality heatmaps as a tile overlay, which is a collection of PNG images displayed on top of a Google Map.\u003c/p\u003e\n"],["\u003cp\u003eEach tile within the overlay has specific (X, Y) coordinates, with (0,0) at the northwest corner and increasing values eastward (X) and southward (Y), determined by the zoom level.\u003c/p\u003e\n"],["\u003cp\u003eThe zoom level (0-16) controls the map's scale and the tile grid size, with higher zoom levels showing more detailed areas.\u003c/p\u003e\n"],["\u003cp\u003eTo request a heatmap tile, you need to provide the heatmap type, zoom level (Z), tile coordinates (X, Y), and your API key in the request URL.\u003c/p\u003e\n"],["\u003cp\u003eYou can overlay these heatmap tiles on top of the default map using methods described in the provided documentation for a comprehensive air quality visualization.\u003c/p\u003e\n"]]],[],null,["The\n[`heatmapTiles`](/maps/documentation/air-quality/reference/rest/v1/mapTypes.heatmapTiles/lookupHeatmapTile)\nendpoint provides air quality related heatmaps through a tile overlay. A tile\noverlay is a collection of PNG image tiles that can be displayed on top of a\nGoogle Maps. Each image tile is (256 x 256 pixels).\n\nAbout heatmap tiles\n\nThe tile overlay is a grid assembled from a collection of tiles,\neach assigned (`X`,`Y`) coordinates.\nThe tile with coordinates (0,0) is always at the northwest corner\nof the map. The `X` values increase from west to east,\nwhile the `Y` values increase from north to south.\n\nThe `zoom level` determines how large or small the contents of a map appear in a\nmap view. The tile grid size is determined by scaling the `X` and `Y`\ncoordinates exponentially by the zoom level. \n\n```text\ngridSizeX = XzoomLevel\ngridSizeY = YzoomLevel\n```\n\nFor example, at a zoom level of 2, the world map is represented using a 4 x 4\nmatrix, for a total of 16 tiles. The zoom also determines what is the max value\nallowed for the coordinates.\n\nThe following image shows a `US_AQI` heatmap with a zoom level of 2,\nalong with the coordinates of each tile:\n\nSee [Map and Tile coordinates](/maps/documentation/javascript/coordinates)\nfor additional details.\n\nAbout the heatmap endpoint\n\nA heatmap tile is represented by a bytes array containing the tile data as a PNG\nimage. You request current air quality heatmap tiles using the\n[`heatmapTiles`](/maps/documentation/air-quality/reference/rest/v1/mapTypes.heatmapTiles/lookupHeatmapTile)\nendpoint by sending an HTTP GET request to: \n\n```html\nhttps://airquality.googleapis.com/v1/mapTypes/TYPE/heatmapTiles/Z/X/Y?key=YOUR_API_KEY\n```\n\nAll request parameters are required in a request:\n\n- `TYPE` - The type heatmap to return. See [allowed\n values](/maps/documentation/air-quality/reference/rest/v1/mapTypes.heatmapTiles/lookupHeatmapTile#maptype).\n\n- `Z` - Zoom level that determines how large or small the contents of a map\n appear in a map view. Allowed values are 0-16, where a value of 0 displays\n the entire world in a single tile.\n\n- `X`,`Y` - The coordinates of the tile to retrieve, relative to the north\n west corner (0,0). `X` values are increasing from west to east and `Y`\n values are increasing from north to south.\n\n Tile coordinates have to be valid for the specified zoom level.\n For example, if you set the zoom level to 2, and request a tile at\n coordinates of 10,10, the API returns an error.\n- `YOUR_API_KEY` - Your application's API key. This key identifies your\n application for purposes of quota management. For more information, see [get\n a key](/maps/documentation/air-quality/get-api-key).\n\nExample heatmap request\n\nThe image above shows a `US_AQI` heatmap with a zoom level of 2,\nalong with the coordinates of each tile. The following example uses the\n`heatmapTiles` endpoint to request the tile at coordinates 0,1 from the\nheatmap: \n\n```html\nhttps://airquality.googleapis.com/v1/mapTypes/US_AQI/heatmapTiles/2/0/1?key=YOUR_API_KEY\n```\n\nThe tile appears as:\n\nFor more information on overlaying tiles on top of the default map, see\n[Overlay Map Types](/maps/documentation/javascript/examples/maptype-overlay)."]]