- Catalog Owner
- Nature Trace
- Dataset Availability
- 2017-01-01T00:00:00Z–2025-01-01T00:00:00Z
- Dataset Producer
- Tags
Description
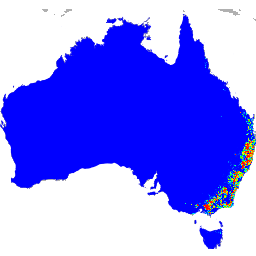
These species distribution model outputs, developed by Google in collaboration with QCIF and EcoCommons, represent estimates of species’ relative occurrence likelihoods (i.e., higher values indicate a higher likelihood that the species would be detected at a location, for a given survey methodology and given survey effort, compared to lower values).
They were generated using a multi-species heterogenous graph neural network model trained jointly on species observation data from the Global Biodiversity Information Facility for 174 Australian mammals from 2017 - 2024 (inclusive), combined with species trait and taxonomy data for the same species from COMBINE, and satellite and environmental as embedded by AlphaEarth Foundations. A previous phase of this work and the model architecture are described here. Estimates of species’ geographical distributions are made at c. 1km resolution (S2 cells level 13).
These distributions are intended to support conservation initiatives like the Global Biodiversity Framework, which includes 30x30. It is likely that distributions could be significantly improved via fine tuning with additional species observation data, where this is available.
Limitations:
- Experimental Status: These results are intended as demonstrations of early research and have not yet been peer-reviewed.
- Aggregate vs. Specific Validation: Model outputs for an earlier run described in the paper have been evaluated collectively against expert-produced Area of Habitation maps (mean ROC AUC = 0.89 over all species, AUC ROC > 0.9 for each of the released species), but have not been vetted by species experts on a species-by-species basis.
- Presence-Only Data Constraints: These models are trained primarily on presence-only data. Outputs represent a relative likelihood of detection given current survey efforts, rather than true probability of occupancy.
- Input Data Bias: The accuracy of these maps is intrinsically linked to the input datasets. Biodiversity observation data is known to contain spatial, temporal, and taxonomic biases (often reflecting accessibility near roads or population centers rather than true biological distribution). The availability of species observation data has also been found to reflect social and political inequities. These biases may be propagated into the final model outputs.
This experimental preview was released November 5, 2025.
Bands
Bands
Pixel size: 1000 meters (all bands)
| Name | Min | Max | Pixel Size | Description |
|---|---|---|---|---|
AgileAntechinus |
0 | 254.48 | 1000 meters | Likelihood of Agile Antechinus occurrence (scaled to [0-250]) |
AustralianSwampRat |
0 | 253.85 | 1000 meters | Likelihood of Australian Swamp Rat occurrence (scaled to [0-250]) |
BlackFlyingFox |
0 | 254.94 | 1000 meters | Likelihood of Black flying fox occurrence (scaled to [0-250]) |
BrownAntechinus |
0 | 254.79 | 1000 meters | Likelihood of Brown Antechinus occurrence (scaled to [0-250]) |
Brush-TailedPhascogale |
0 | 242.99 | 1000 meters | Likelihood of Brush-tailed Phascogale occurrence (scaled to [0-250]) |
Brush-TailedRock-Wallaby |
0 | 252.78 | 1000 meters | Likelihood of Brush-tailed Rock-wallaby occurrence (scaled to [0-250]) |
BushRat |
0 | 254.55 | 1000 meters | Likelihood of Bush Rat occurrence (scaled to [0-250]) |
CommonRingtailPossum |
0 | 254.98 | 1000 meters | Likelihood of Common Ringtail Possum occurrence (scaled to [0-250]) |
CommonWombat |
0 | 253.88 | 1000 meters | Likelihood of Common Wombat occurrence (scaled to [0-250]) |
EasternGreyKangaroo |
0 | 253.93 | 1000 meters | Likelihood of Eastern Grey Kangaroo occurrence (scaled to [0-250]) |
GreaterGlider |
0 | 254.84 | 1000 meters | Likelihood of Greater Glider occurrence (scaled to [0-250]) |
HastingsRiverMouse |
0 | 243.4 | 1000 meters | Likelihood of Hastings River Mouse occurrence (scaled to [0-250]) |
LeadbeatersPossum |
0 | 254.99 | 1000 meters | Likelihood of Leadbeater's Possum occurrence (scaled to [0-250]) |
Long-NosedBandicoot |
0 | 254.13 | 1000 meters | Likelihood of Long-nosed Bandicoot occurrence (scaled to [0-250]) |
Long-NosedPotoroo |
0 | 252.91 | 1000 meters | Likelihood of Long-nosed Potoroo occurrence (scaled to [0-250]) |
LumholtzsTree-Kangaroo |
0 | 253.14 | 1000 meters | Likelihood of Lumholtz's Tree-kangaroo occurrence (scaled to [0-250]) |
MountainBrushtailPossum |
0 | 254.95 | 1000 meters | Likelihood of Mountain Brushtail Possum occurrence (scaled to [0-250]) |
NorthernBrownBandicoot |
0 | 247.76 | 1000 meters | Likelihood of Northern Brown Bandicoot occurrence (scaled to [0-250]) |
Platypus |
0 | 254.59 | 1000 meters | Likelihood of Platypus occurrence (scaled to [0-250]) |
Short-EaredPossum |
0 | 254.36 | 1000 meters | Likelihood of Short-eared Possum occurrence (scaled to [0-250]) |
SouthernBrownBandicoot |
0 | 254.41 | 1000 meters | Likelihood of Southern Brown Bandicoot occurrence (scaled to [0-250]) |
SquirrelGlider |
0 | 234.98 | 1000 meters | Likelihood of Squirrel Glider occurrence (scaled to [0-250]) |
SwampWallaby |
0 | 253.3 | 1000 meters | Likelihood of Swamp Wallaby occurrence (scaled to [0-250]) |
WesternGreyKangaroo |
0 | 254.99 | 1000 meters | Likelihood of Western Grey Kangaroo occurrence (scaled to [0-250]) |
Yellow-FootedAntechinus |
0 | 254.58 | 1000 meters | Likelihood of Yellow-footed Antechinus occurrence (scaled to [0-250]) |
Terms of Use
Terms of Use
All materials are licensed under the Creative Commons Attribution 4.0 International License (CC-BY 4.0).
Attribution: "Dataset developed by Google in collaboration with QCIF and EcoCommons."
Unless required by applicable law or agreed to in writing, all materials distributed here under the CC-BY license are distributed on an "AS IS" BASIS, WITHOUT WARRANTIES OR CONDITIONS OF ANY KIND, either express or implied. See the license for the specific language governing permissions and limitations under those licenses.
This is not an official Google product.
Citations
Google LLC, "Australian mammal species distributions" (2025). Available online at https://developers.google.com/earth-engine/datasets/catalog/projects_nature-trace_assets_species_distribution_models_australia_mammals_v0.
Explore with Earth Engine
Code Editor (JavaScript)
var dataset = ee.Image(
    'projects/nature-trace/assets/species_distribution_models/australia_mammals/v0');
var species = dataset.select('GreaterGlider');
var occurrenceVis = {
  min: 0,
  max: 250,
  palette: [
    '0000FF', '004FFF', '009DFF', '00ECFF', '00FFC4', '00FF75', '00FF27',
    '28FF00', '76FF00', 'C5FF00', 'FFEB00', 'FF9C00', 'FF4E00', 'FF0000'
  ]
};
Map.setCenter(133.4, -26.6, 5);
Map.addLayer(species, occurrenceVis, 'GreaterGlider');