꽃가루 지수 (UPI)란 무엇인가요?
꽃가루 지수 (UPI)는 다양한 지역의 꽃가루 수치를 비교할 수 있는 전 세계적으로 통합된 단위를 제공하도록 설계되었습니다. 이 지수는 꽃가루에 알레르기가 있거나 민감한 사람들을 위해 다양한 요인을 기반으로 꽃가루 노출 위험을 평가하는 데 도움이 됩니다. 다층 모델을 기반으로 하며, 식물 모델당 농도, 전 세계에서 사용되는 다양한 지역 꽃가루 지수 (LPI), 다양한 식물 꽃가루 유형의 알레르기성을 고려하여 일일 입방미터당 꽃가루 수 (grains/m3)를 예측하는 꽃가루 수치 데이터의 표현입니다.
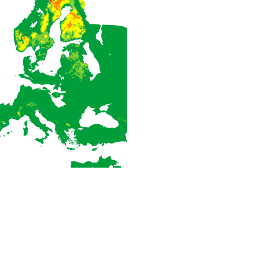
heatmapTiles 엔드포인트는 기본 지도에 오버레이할 수 있는 히트맵 타일을 반환합니다. 히트맵 타일은 지정된 식물 유형 (TREE, GRASS 또는 WEED)에 대한 전 세계 UPI를 표시합니다.
지수는 다음 6가지 카테고리로 구성됩니다.
| 값 | 색상 | 설명 |
|---|---|---|
| 0 | 없음 | |
| 1 | 매우 부족 | |
| 2 | 낮음 | |
| 3 | 보통 | |
| 4 | 높음 | |
| 5 | 매우 높음 |
각 카테고리는 특정 지역의 꽃가루 농도와 일반적으로 경험하는 알레르기 증상의 심각도에 미치는 영향을 기반으로 하며, 꽃가루 수준을 포괄적으로 나타냅니다. UPI를 통합하면 사용자가 다양한 지역의 꽃가루 상태를 비교하고 평가할 수 있습니다.
예를 들어 다음 히트맵 타일은 TREE 꽃가루 수치가 매우 낮음에서 매우 높음까지 다양함을 보여줍니다.

지원되는 식물
꽃가루 API는 잔디, 잡초, 나무의 세 가지 식물 유형을 지원합니다. 식물의 가용성은 실제 데이터 소스 측정 및 보고서에 따라 달라지므로 꽃가루 API 식물 데이터는 지역에 따라 다를 수 있습니다.
다음 목록에는 지원되는 공장 코드와 해당 메타데이터가 표시됩니다.
| 플랜트 코드 | 표시 이름 | 유형 |
|---|---|---|
ALDER |
Alder | 트리 |
ASH |
애쉬 그레이 | 트리 |
BIRCH |
자작나무 | 트리 |
COTTONWOOD |
Cottonwood | 트리 |
ELM |
Elm | 트리 |
MAPLE |
Maple | 트리 |
OLIVE |
Olive | 트리 |
JUNIPER |
Juniper | 트리 |
OAK |
오크 나무 | 트리 |
PINE |
소나무 | 트리 |
CYPRESS_PINE |
사이프러스 소나무 | 트리 |
HAZEL |
헤이즐 | 트리 |
GRAMINALES |
풀 | 잔디 |
JAPANESE_CEDAR |
일본 삼나무 | 트리 |
JAPANESE_CYPRESS |
일본 편백나무 | 트리 |
RAGWEED |
돼지풀 | 잡초 |
MUGWORT |
쑥 | 잡초 |

