Mantenha tudo organizado com as coleções
Salve e categorize o conteúdo com base nas suas preferências.
O endpoint
heatmapTiles
fornece mapas de calor relacionados ao pólen usando a sobreposição de blocos. Uma sobreposição de blocos
é uma coleção de blocos de imagens que podem ser mostrados sobre o Google Maps. Cada bloco de imagem tem 256 x 256 pixels.
A sobreposição de blocos é uma grade montada com base em uma coleção de blocos, cada um com coordenadas (X,Y) atribuídas. O bloco com as coordenadas (0,0) está sempre no canto noroeste do mapa. Os valores de X aumentam de oeste para leste, enquanto os valores de Y aumentam de norte para sul.
O zoom level determina o tamanho do conteúdo de um mapa em uma visualização de mapa. O tamanho da grade de blocos é determinado pelo escalonamento exponencial das coordenadas X e Y pelo nível de zoom.
gridSizeX = XzoomLevel
gridSizeY = YzoomLevel
Por exemplo, no nível de zoom 2, o mapa-múndi é representado usando uma matriz de 4 x 4, totalizando 16 blocos.
A imagem a seguir mostra um mapa de calor TREE_UPI do mundo inteiro, dividido em blocos que podem ser acessados em um nível de zoom 2.
Todos os parâmetros listados abaixo são obrigatórios para uma solicitação bem-sucedida:
KEY: a chave de API do seu aplicativo. Essa chave identifica seu aplicativo para fins de gerenciamento de cota. Saiba como receber uma chave.
TYPE: o tipo de mapa de calor a ser retornado. Consulte allowed
values.
Z: nível de zoom que determina o tamanho do conteúdo de um mapa
em uma visualização de mapa. Os valores permitidos são de 0 a 16, em que o valor 0 mostra o mundo inteiro em um único bloco.
X,Y: as coordenadas do bloco em relação ao canto nordeste (0,0). Os valores de X aumentam de oeste para leste, e os valores de Y aumentam de norte para sul. As coordenadas precisam ser válidas para o nível de zoom especificado. Por exemplo, se você definir o nível de zoom como 2 e solicitar um bloco nas coordenadas (10,10), a API vai retornar um erro.
Exemplo de solicitação de mapa de calor
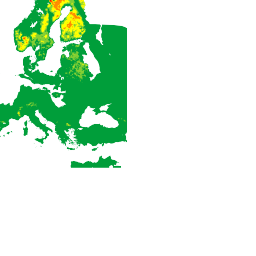
A imagem acima mostra um mapa de calor TREE_UPI com um nível de zoom de 2, além das coordenadas de cada bloco. O exemplo a seguir usa o endpoint heatmapTiles para solicitar o bloco nas coordenadas (2,1):
[[["Fácil de entender","easyToUnderstand","thumb-up"],["Meu problema foi resolvido","solvedMyProblem","thumb-up"],["Outro","otherUp","thumb-up"]],[["Não contém as informações de que eu preciso","missingTheInformationINeed","thumb-down"],["Muito complicado / etapas demais","tooComplicatedTooManySteps","thumb-down"],["Desatualizado","outOfDate","thumb-down"],["Problema na tradução","translationIssue","thumb-down"],["Problema com as amostras / o código","samplesCodeIssue","thumb-down"],["Outro","otherDown","thumb-down"]],["Última atualização 2025-08-31 UTC."],[[["\u003cp\u003eThe heatmapTiles endpoint delivers pollen heatmaps as tile overlays, which are collections of 256x256 pixel image tiles displayed on top of Google Maps.\u003c/p\u003e\n"],["\u003cp\u003eTile coordinates (X,Y) determine the grid position, with (0,0) at the northwest corner and increasing values eastward for X and southward for Y.\u003c/p\u003e\n"],["\u003cp\u003eZoom level (Z) controls map content size and grid dimensions, ranging from 0 (entire world) to 16, influencing tile coordinates validity.\u003c/p\u003e\n"],["\u003cp\u003eTo request heatmap tiles, use the heatmapTiles endpoint with required parameters: API key, heatmap type, zoom level, and tile coordinates (X,Y).\u003c/p\u003e\n"],["\u003cp\u003eYou can overlay these pollen heatmap tiles onto existing maps for visualization, enhancing applications with pollen information.\u003c/p\u003e\n"]]],["The `heatmapTiles` endpoint provides pollen heatmaps as image tiles (256x256 pixels) overlaid on Google Maps. Tiles are arranged in a grid with (X,Y) coordinates, starting from (0,0) in the northwest. The zoom level (0-16) dictates map detail, scaling the grid exponentially (gridSizeX = X^zoomLevel). A request to the endpoint requires an API key, heatmap `TYPE`, `Z` zoom level, and `X`, `Y` tile coordinates. The format for a request is: `https://pollen.googleapis.com/v1/mapTypes/TYPE/heatmapTiles/Z/X/Y?key=YOUR_API_KEY`\n"],null,["# Heatmaps\n\nThe\n[heatmapTiles](/maps/documentation/pollen/reference/rest/v1/mapTypes.heatmapTiles/lookupHeatmapTile)\nendpoint provides pollen-related heatmaps through tile overlay. A tile overlay\nis a collection of image tiles that can be displayed on top of Google Maps. Each\nimage tile is 256 x 256 pixels.\n\nThe tile overlay is a grid assembled from a collection of tiles, each assigned\n(`X`,`Y`) coordinates. The tile with coordinates (0,0) is always at the\nnorthwest corner of the map. The `X` values increase from west to east, while\nthe `Y` values increase from north to south.\n\nThe `zoom level` determines how large or small the contents of a map appear in a\nmap view. The tile grid size is determined by scaling the `X` and `Y`\ncoordinates exponentially by the zoom level. \n\n```text\ngridSizeX = XzoomLevel\ngridSizeY = YzoomLevel\n```\n\nFor example, at a zoom level of 2, the world map is represented using a 4 x 4\nmatrix, for a total of 16 tiles.\n\nThe following image shows a `TREE_UPI` heatmap of the entire world, sectioned\ninto tiles that can be accessed at a zoom level of 2.\n\nSee [Map and Tile\ncoordinates](/maps/documentation/javascript/coordinates#tile-coordinates) for\nadditional details.\n\nYou can request current pollen heatmap tiles using the [heatmapTiles](/maps/documentation/pollen/reference/rest/v1/mapTypes.heatmapTiles/lookupHeatmapTile)\nendpoint by sending an HTTP GET request to: \n\n```html\nhttps://pollen.googleapis.com/v1/mapTypes/TYPE/heatmapTiles/Z/X/Y?key=YOUR_API_KEY\n```\n\nAbout the heatmap endpoint\n--------------------------\n\nAll parameters listed below are required for a successful request:\n\n- `KEY`: Your application's API key. This key identifies your application for purposes of quota management. Learn how to [get a\n key](/maps/documentation/pollen/get-api-key).\n- `TYPE`: The type of heatmap to return. See [allowed\n values](/maps/documentation/pollen/reference/rest/v1/mapTypes.heatmapTiles/lookupHeatmapTile#maptype).\n- `Z`: Zoom level that determines how large or small the contents of a map appear in a map view. Allowed values are 0-16, where a value of 0 displays the entire world in a single tile.\n- `X`,`Y`: The tile coordinates relatively to the north east corner (0,0). `X` values increase from west to east and `Y` values increase from north to south. Coordinates must be valid for the specified zoom level. For example, if you set the zoom level to 2 and request a tile at coordinates (10,10), the API returns an error.\n\nExample heatmap request\n-----------------------\n\nThe image above shows a `TREE_UPI` heatmap with a zoom level of 2, along with\nthe coordinates of each tile. The following example uses the `heatmapTiles`\nendpoint to request the tile at coordinates (2,1): \n\n```html\nhttps://pollen.googleapis.com/v1/mapTypes/TREE_UPI/heatmapTiles/2/2/1?key=YOUR_API_KEY\n```\n\nThe tile appears as an image that can be overlaid on a map:\n\nFor more information on overlaying tiles on top of the default map, see\n[Overlay Map Types](/maps/documentation/javascript/examples/maptype-overlay)."]]