Mantieni tutto organizzato con le raccolte
Salva e classifica i contenuti in base alle tue preferenze.
L'endpoint
heatmapTiles
fornisce mappe termiche relative al polline tramite overlay delle tessere. Un overlay a riquadro
è una raccolta di riquadri immagine che possono essere visualizzati sopra Google Maps. Ogni
riquadro dell'immagine è 256 x 256 pixel.
L'overlay riquadri è una griglia assemblata da una raccolta di riquadri, a ognuno dei quali sono assegnate
coordinate (X,Y). Il riquadro con le coordinate (0,0) si trova sempre
nell'angolo nord-ovest della mappa. I valori di X aumentano da ovest a est, mentre
i valori di Y aumentano da nord a sud.
Il zoom level determina le dimensioni dei contenuti di una mappa in una
visualizzazione della mappa. Le dimensioni della griglia dei riquadri sono determinate dalla scalabilità delle coordinate X e Y
in modo esponenziale in base al livello di zoom.
gridSizeX = XzoomLevel
gridSizeY = YzoomLevel
Ad esempio, a un livello di zoom pari a 2, la mappa del mondo è rappresentata utilizzando una matrice 4 x 4, per un totale di 16 riquadri.
L'immagine seguente mostra una mappa termica TREE_UPI del mondo intero, suddivisa
in riquadri accessibili a un livello di zoom pari a 2.
Tutti i parametri elencati di seguito sono obbligatori per una richiesta riuscita:
KEY: la chiave API della tua applicazione. Questa chiave identifica la tua applicazione ai fini della gestione delle quote. Scopri come ottenere una
chiave.
TYPE: il tipo di mappa di calore da restituire. Vedi i valori
consentiti.
Z: il livello di zoom che determina le dimensioni dei contenuti di una mappa
in una visualizzazione della mappa. Sono consentiti valori compresi tra 0 e 16, dove un valore pari a 0 mostra
il mondo intero in un'unica tessera.
X,Y: le coordinate del riquadro rispetto all'angolo nord-est (0,0). I valori di X aumentano da ovest a est e i valori di Y aumentano da nord a sud. Le coordinate devono essere valide per il livello di zoom specificato. Ad esempio, se imposti il livello di zoom su 2 e richiedi un riquadro alle coordinate (10,10), l'API restituisce un errore.
Esempio di richiesta della mappa termica
L'immagine sopra mostra una mappa termica TREE_UPI con un livello di zoom pari a 2, insieme
alle coordinate di ogni riquadro. L'esempio seguente utilizza l'endpoint heatmapTiles
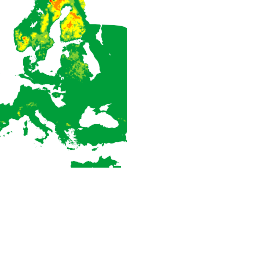
per richiedere il riquadro alle coordinate (2,1):
[[["Facile da capire","easyToUnderstand","thumb-up"],["Il problema è stato risolto","solvedMyProblem","thumb-up"],["Altra","otherUp","thumb-up"]],[["Mancano le informazioni di cui ho bisogno","missingTheInformationINeed","thumb-down"],["Troppo complicato/troppi passaggi","tooComplicatedTooManySteps","thumb-down"],["Obsoleti","outOfDate","thumb-down"],["Problema di traduzione","translationIssue","thumb-down"],["Problema relativo a esempi/codice","samplesCodeIssue","thumb-down"],["Altra","otherDown","thumb-down"]],["Ultimo aggiornamento 2025-08-31 UTC."],[[["\u003cp\u003eThe heatmapTiles endpoint delivers pollen heatmaps as tile overlays, which are collections of 256x256 pixel image tiles displayed on top of Google Maps.\u003c/p\u003e\n"],["\u003cp\u003eTile coordinates (X,Y) determine the grid position, with (0,0) at the northwest corner and increasing values eastward for X and southward for Y.\u003c/p\u003e\n"],["\u003cp\u003eZoom level (Z) controls map content size and grid dimensions, ranging from 0 (entire world) to 16, influencing tile coordinates validity.\u003c/p\u003e\n"],["\u003cp\u003eTo request heatmap tiles, use the heatmapTiles endpoint with required parameters: API key, heatmap type, zoom level, and tile coordinates (X,Y).\u003c/p\u003e\n"],["\u003cp\u003eYou can overlay these pollen heatmap tiles onto existing maps for visualization, enhancing applications with pollen information.\u003c/p\u003e\n"]]],["The `heatmapTiles` endpoint provides pollen heatmaps as image tiles (256x256 pixels) overlaid on Google Maps. Tiles are arranged in a grid with (X,Y) coordinates, starting from (0,0) in the northwest. The zoom level (0-16) dictates map detail, scaling the grid exponentially (gridSizeX = X^zoomLevel). A request to the endpoint requires an API key, heatmap `TYPE`, `Z` zoom level, and `X`, `Y` tile coordinates. The format for a request is: `https://pollen.googleapis.com/v1/mapTypes/TYPE/heatmapTiles/Z/X/Y?key=YOUR_API_KEY`\n"],null,["# Heatmaps\n\nThe\n[heatmapTiles](/maps/documentation/pollen/reference/rest/v1/mapTypes.heatmapTiles/lookupHeatmapTile)\nendpoint provides pollen-related heatmaps through tile overlay. A tile overlay\nis a collection of image tiles that can be displayed on top of Google Maps. Each\nimage tile is 256 x 256 pixels.\n\nThe tile overlay is a grid assembled from a collection of tiles, each assigned\n(`X`,`Y`) coordinates. The tile with coordinates (0,0) is always at the\nnorthwest corner of the map. The `X` values increase from west to east, while\nthe `Y` values increase from north to south.\n\nThe `zoom level` determines how large or small the contents of a map appear in a\nmap view. The tile grid size is determined by scaling the `X` and `Y`\ncoordinates exponentially by the zoom level. \n\n```text\ngridSizeX = XzoomLevel\ngridSizeY = YzoomLevel\n```\n\nFor example, at a zoom level of 2, the world map is represented using a 4 x 4\nmatrix, for a total of 16 tiles.\n\nThe following image shows a `TREE_UPI` heatmap of the entire world, sectioned\ninto tiles that can be accessed at a zoom level of 2.\n\nSee [Map and Tile\ncoordinates](/maps/documentation/javascript/coordinates#tile-coordinates) for\nadditional details.\n\nYou can request current pollen heatmap tiles using the [heatmapTiles](/maps/documentation/pollen/reference/rest/v1/mapTypes.heatmapTiles/lookupHeatmapTile)\nendpoint by sending an HTTP GET request to: \n\n```html\nhttps://pollen.googleapis.com/v1/mapTypes/TYPE/heatmapTiles/Z/X/Y?key=YOUR_API_KEY\n```\n\nAbout the heatmap endpoint\n--------------------------\n\nAll parameters listed below are required for a successful request:\n\n- `KEY`: Your application's API key. This key identifies your application for purposes of quota management. Learn how to [get a\n key](/maps/documentation/pollen/get-api-key).\n- `TYPE`: The type of heatmap to return. See [allowed\n values](/maps/documentation/pollen/reference/rest/v1/mapTypes.heatmapTiles/lookupHeatmapTile#maptype).\n- `Z`: Zoom level that determines how large or small the contents of a map appear in a map view. Allowed values are 0-16, where a value of 0 displays the entire world in a single tile.\n- `X`,`Y`: The tile coordinates relatively to the north east corner (0,0). `X` values increase from west to east and `Y` values increase from north to south. Coordinates must be valid for the specified zoom level. For example, if you set the zoom level to 2 and request a tile at coordinates (10,10), the API returns an error.\n\nExample heatmap request\n-----------------------\n\nThe image above shows a `TREE_UPI` heatmap with a zoom level of 2, along with\nthe coordinates of each tile. The following example uses the `heatmapTiles`\nendpoint to request the tile at coordinates (2,1): \n\n```html\nhttps://pollen.googleapis.com/v1/mapTypes/TREE_UPI/heatmapTiles/2/2/1?key=YOUR_API_KEY\n```\n\nThe tile appears as an image that can be overlaid on a map:\n\nFor more information on overlaying tiles on top of the default map, see\n[Overlay Map Types](/maps/documentation/javascript/examples/maptype-overlay)."]]