Koleksiyonlar ile düzeninizi koruyun
İçeriği tercihlerinize göre kaydedin ve kategorilere ayırın.
heatmapTiles uç noktası, döşeme yerleşimi aracılığıyla polenle ilgili ısı haritaları sağlar. Karo yer paylaşımı, Google Haritalar'ın üzerinde görüntülenebilen bir dizi resim karosudur. Her
resim kutucuğu 256 x 256 pikseldir.
Yer paylaşımı karosu, her birine (X,Y) koordinatları atanmış bir karo koleksiyonundan oluşturulan bir ızgaradır. Koordinatları (0,0) olan parça her zaman haritanın kuzeybatı köşesindedir. X değerleri batıdan doğuya, Y değerleri ise kuzeyden güneye doğru artar.
zoom level, harita görünümünde harita içeriklerinin ne kadar büyük veya küçük görüneceğini belirler. Döşeme ızgarası boyutu, X ve Y koordinatlarının yakınlaştırma düzeyine göre üstel olarak ölçeklendirilmesiyle belirlenir.
gridSizeX = XzoomLevel
gridSizeY = YzoomLevel
Örneğin, 2 yakınlaştırma düzeyinde dünya haritası 4 x 4 matris kullanılarak gösterilir ve toplamda 16 kutu bulunur.
Aşağıdaki resimde, 2 yakınlaştırma düzeyinde erişilebilen kutulara bölünmüş, tüm dünyanın TREE_UPI ısı haritası gösterilmektedir.
Başarılı bir istek için aşağıda listelenen tüm parametreler gereklidir:
KEY: Uygulamanızın API anahtarı. Bu anahtar, kota yönetimi amacıyla uygulamanızı tanımlar. Nasıl anahtar alacağınızı öğrenin.
TYPE: Döndürülecek ısı haritasının türü. İzin verilen değerler başlıklı makaleyi inceleyin.
Z: Harita görünümünde harita içeriklerinin ne kadar büyük veya küçük görüneceğini belirleyen yakınlaştırma düzeyi. İzin verilen değerler 0-16'dır. 0 değeri, tüm dünyayı tek bir kutuda gösterir.
X,Y: Kuzeydoğu köşesine (0,0) göre döşeme koordinatları. X
değerleri batıdan doğuya, Y değerleri ise kuzeyden güneye doğru artar. Koordinatlar, belirtilen yakınlaştırma düzeyi için geçerli olmalıdır. Örneğin, yakınlaştırma düzeyini 2 olarak ayarlayıp (10,10) koordinatlarında bir döşeme isterseniz API hata döndürür.
Örnek ısı haritası isteği
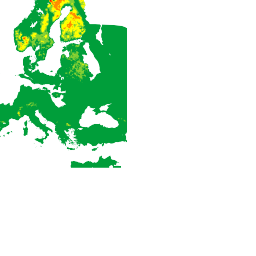
Yukarıdaki resimde, her kutucuğun koordinatlarıyla birlikte 2 yakınlaştırma düzeyine sahip bir TREE_UPI ısı haritası gösterilmektedir. Aşağıdaki örnekte, (2,1) koordinatlarındaki döşemeyi istemek için heatmapTiles
uç noktası kullanılmaktadır:
[[["Anlaması kolay","easyToUnderstand","thumb-up"],["Sorunumu çözdü","solvedMyProblem","thumb-up"],["Diğer","otherUp","thumb-up"]],[["İhtiyacım olan bilgiler yok","missingTheInformationINeed","thumb-down"],["Çok karmaşık / çok fazla adım var","tooComplicatedTooManySteps","thumb-down"],["Güncel değil","outOfDate","thumb-down"],["Çeviri sorunu","translationIssue","thumb-down"],["Örnek veya kod sorunu","samplesCodeIssue","thumb-down"],["Diğer","otherDown","thumb-down"]],["Son güncelleme tarihi: 2025-08-31 UTC."],[[["\u003cp\u003eThe heatmapTiles endpoint delivers pollen heatmaps as tile overlays, which are collections of 256x256 pixel image tiles displayed on top of Google Maps.\u003c/p\u003e\n"],["\u003cp\u003eTile coordinates (X,Y) determine the grid position, with (0,0) at the northwest corner and increasing values eastward for X and southward for Y.\u003c/p\u003e\n"],["\u003cp\u003eZoom level (Z) controls map content size and grid dimensions, ranging from 0 (entire world) to 16, influencing tile coordinates validity.\u003c/p\u003e\n"],["\u003cp\u003eTo request heatmap tiles, use the heatmapTiles endpoint with required parameters: API key, heatmap type, zoom level, and tile coordinates (X,Y).\u003c/p\u003e\n"],["\u003cp\u003eYou can overlay these pollen heatmap tiles onto existing maps for visualization, enhancing applications with pollen information.\u003c/p\u003e\n"]]],["The `heatmapTiles` endpoint provides pollen heatmaps as image tiles (256x256 pixels) overlaid on Google Maps. Tiles are arranged in a grid with (X,Y) coordinates, starting from (0,0) in the northwest. The zoom level (0-16) dictates map detail, scaling the grid exponentially (gridSizeX = X^zoomLevel). A request to the endpoint requires an API key, heatmap `TYPE`, `Z` zoom level, and `X`, `Y` tile coordinates. The format for a request is: `https://pollen.googleapis.com/v1/mapTypes/TYPE/heatmapTiles/Z/X/Y?key=YOUR_API_KEY`\n"],null,["# Heatmaps\n\nThe\n[heatmapTiles](/maps/documentation/pollen/reference/rest/v1/mapTypes.heatmapTiles/lookupHeatmapTile)\nendpoint provides pollen-related heatmaps through tile overlay. A tile overlay\nis a collection of image tiles that can be displayed on top of Google Maps. Each\nimage tile is 256 x 256 pixels.\n\nThe tile overlay is a grid assembled from a collection of tiles, each assigned\n(`X`,`Y`) coordinates. The tile with coordinates (0,0) is always at the\nnorthwest corner of the map. The `X` values increase from west to east, while\nthe `Y` values increase from north to south.\n\nThe `zoom level` determines how large or small the contents of a map appear in a\nmap view. The tile grid size is determined by scaling the `X` and `Y`\ncoordinates exponentially by the zoom level. \n\n```text\ngridSizeX = XzoomLevel\ngridSizeY = YzoomLevel\n```\n\nFor example, at a zoom level of 2, the world map is represented using a 4 x 4\nmatrix, for a total of 16 tiles.\n\nThe following image shows a `TREE_UPI` heatmap of the entire world, sectioned\ninto tiles that can be accessed at a zoom level of 2.\n\nSee [Map and Tile\ncoordinates](/maps/documentation/javascript/coordinates#tile-coordinates) for\nadditional details.\n\nYou can request current pollen heatmap tiles using the [heatmapTiles](/maps/documentation/pollen/reference/rest/v1/mapTypes.heatmapTiles/lookupHeatmapTile)\nendpoint by sending an HTTP GET request to: \n\n```html\nhttps://pollen.googleapis.com/v1/mapTypes/TYPE/heatmapTiles/Z/X/Y?key=YOUR_API_KEY\n```\n\nAbout the heatmap endpoint\n--------------------------\n\nAll parameters listed below are required for a successful request:\n\n- `KEY`: Your application's API key. This key identifies your application for purposes of quota management. Learn how to [get a\n key](/maps/documentation/pollen/get-api-key).\n- `TYPE`: The type of heatmap to return. See [allowed\n values](/maps/documentation/pollen/reference/rest/v1/mapTypes.heatmapTiles/lookupHeatmapTile#maptype).\n- `Z`: Zoom level that determines how large or small the contents of a map appear in a map view. Allowed values are 0-16, where a value of 0 displays the entire world in a single tile.\n- `X`,`Y`: The tile coordinates relatively to the north east corner (0,0). `X` values increase from west to east and `Y` values increase from north to south. Coordinates must be valid for the specified zoom level. For example, if you set the zoom level to 2 and request a tile at coordinates (10,10), the API returns an error.\n\nExample heatmap request\n-----------------------\n\nThe image above shows a `TREE_UPI` heatmap with a zoom level of 2, along with\nthe coordinates of each tile. The following example uses the `heatmapTiles`\nendpoint to request the tile at coordinates (2,1): \n\n```html\nhttps://pollen.googleapis.com/v1/mapTypes/TREE_UPI/heatmapTiles/2/2/1?key=YOUR_API_KEY\n```\n\nThe tile appears as an image that can be overlaid on a map:\n\nFor more information on overlaying tiles on top of the default map, see\n[Overlay Map Types](/maps/documentation/javascript/examples/maptype-overlay)."]]