Sử dụng bộ sưu tập để sắp xếp ngăn nắp các trang
Lưu và phân loại nội dung dựa trên lựa chọn ưu tiên của bạn.
Điểm cuối heatmapTiles cung cấp bản đồ nhiệt liên quan đến phấn hoa thông qua lớp phủ ô. Lớp phủ dạng ô là một tập hợp các ô hình ảnh có thể hiển thị ở trên cùng của Google Maps. Mỗi ô hình ảnh có kích thước 256 x 256 pixel.
Lớp phủ ô vuông là một lưới được tạo thành từ một tập hợp các ô vuông, mỗi ô vuông được chỉ định toạ độ (X,Y). Ô vuông có toạ độ (0,0) luôn nằm ở góc tây bắc của bản đồ. Các giá trị X tăng từ tây sang đông, trong khi các giá trị Y tăng từ bắc xuống nam.
zoom level xác định nội dung của bản đồ xuất hiện lớn hay nhỏ trong một khung hiển thị bản đồ. Kích thước lưới ô được xác định bằng cách mở rộng quy mô các toạ độ X và Y theo cấp số nhân theo mức thu phóng.
gridSizeX = XzoomLevel
gridSizeY = YzoomLevel
Ví dụ: ở mức thu phóng 2, bản đồ thế giới được biểu thị bằng ma trận 4 x 4, tổng cộng là 16 ô.
Hình ảnh sau đây cho thấy một bản đồ nhiệt TREE_UPI của toàn thế giới, được chia thành các ô có thể truy cập ở mức thu phóng là 2.
Z: Mức thu phóng xác định nội dung của bản đồ xuất hiện lớn hay nhỏ trong một khung hiển thị bản đồ. Các giá trị được phép là 0-16, trong đó giá trị 0 hiển thị toàn bộ thế giới trong một ô duy nhất.
X,Y: Toạ độ ô tương ứng với góc đông bắc (0,0). Giá trị X tăng từ tây sang đông và giá trị Y tăng từ bắc xuống nam. Toạ độ phải hợp lệ cho mức thu phóng được chỉ định. Ví dụ: nếu bạn đặt mức thu phóng thành 2 và yêu cầu một ô ở toạ độ (10,10), thì API sẽ trả về lỗi.
Ví dụ về yêu cầu bản đồ nhiệt
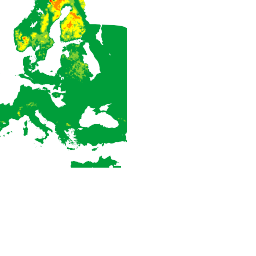
Hình ảnh ở trên cho thấy một bản đồ nhiệt TREE_UPI với mức thu phóng là 2, cùng với toạ độ của từng ô. Ví dụ sau đây sử dụng điểm cuối heatmapTiles để yêu cầu ô ở toạ độ (2,1):
[[["Dễ hiểu","easyToUnderstand","thumb-up"],["Giúp tôi giải quyết được vấn đề","solvedMyProblem","thumb-up"],["Khác","otherUp","thumb-up"]],[["Thiếu thông tin tôi cần","missingTheInformationINeed","thumb-down"],["Quá phức tạp/quá nhiều bước","tooComplicatedTooManySteps","thumb-down"],["Đã lỗi thời","outOfDate","thumb-down"],["Vấn đề về bản dịch","translationIssue","thumb-down"],["Vấn đề về mẫu/mã","samplesCodeIssue","thumb-down"],["Khác","otherDown","thumb-down"]],["Cập nhật lần gần đây nhất: 2025-08-31 UTC."],[[["\u003cp\u003eThe heatmapTiles endpoint delivers pollen heatmaps as tile overlays, which are collections of 256x256 pixel image tiles displayed on top of Google Maps.\u003c/p\u003e\n"],["\u003cp\u003eTile coordinates (X,Y) determine the grid position, with (0,0) at the northwest corner and increasing values eastward for X and southward for Y.\u003c/p\u003e\n"],["\u003cp\u003eZoom level (Z) controls map content size and grid dimensions, ranging from 0 (entire world) to 16, influencing tile coordinates validity.\u003c/p\u003e\n"],["\u003cp\u003eTo request heatmap tiles, use the heatmapTiles endpoint with required parameters: API key, heatmap type, zoom level, and tile coordinates (X,Y).\u003c/p\u003e\n"],["\u003cp\u003eYou can overlay these pollen heatmap tiles onto existing maps for visualization, enhancing applications with pollen information.\u003c/p\u003e\n"]]],["The `heatmapTiles` endpoint provides pollen heatmaps as image tiles (256x256 pixels) overlaid on Google Maps. Tiles are arranged in a grid with (X,Y) coordinates, starting from (0,0) in the northwest. The zoom level (0-16) dictates map detail, scaling the grid exponentially (gridSizeX = X^zoomLevel). A request to the endpoint requires an API key, heatmap `TYPE`, `Z` zoom level, and `X`, `Y` tile coordinates. The format for a request is: `https://pollen.googleapis.com/v1/mapTypes/TYPE/heatmapTiles/Z/X/Y?key=YOUR_API_KEY`\n"],null,["# Heatmaps\n\nThe\n[heatmapTiles](/maps/documentation/pollen/reference/rest/v1/mapTypes.heatmapTiles/lookupHeatmapTile)\nendpoint provides pollen-related heatmaps through tile overlay. A tile overlay\nis a collection of image tiles that can be displayed on top of Google Maps. Each\nimage tile is 256 x 256 pixels.\n\nThe tile overlay is a grid assembled from a collection of tiles, each assigned\n(`X`,`Y`) coordinates. The tile with coordinates (0,0) is always at the\nnorthwest corner of the map. The `X` values increase from west to east, while\nthe `Y` values increase from north to south.\n\nThe `zoom level` determines how large or small the contents of a map appear in a\nmap view. The tile grid size is determined by scaling the `X` and `Y`\ncoordinates exponentially by the zoom level. \n\n```text\ngridSizeX = XzoomLevel\ngridSizeY = YzoomLevel\n```\n\nFor example, at a zoom level of 2, the world map is represented using a 4 x 4\nmatrix, for a total of 16 tiles.\n\nThe following image shows a `TREE_UPI` heatmap of the entire world, sectioned\ninto tiles that can be accessed at a zoom level of 2.\n\nSee [Map and Tile\ncoordinates](/maps/documentation/javascript/coordinates#tile-coordinates) for\nadditional details.\n\nYou can request current pollen heatmap tiles using the [heatmapTiles](/maps/documentation/pollen/reference/rest/v1/mapTypes.heatmapTiles/lookupHeatmapTile)\nendpoint by sending an HTTP GET request to: \n\n```html\nhttps://pollen.googleapis.com/v1/mapTypes/TYPE/heatmapTiles/Z/X/Y?key=YOUR_API_KEY\n```\n\nAbout the heatmap endpoint\n--------------------------\n\nAll parameters listed below are required for a successful request:\n\n- `KEY`: Your application's API key. This key identifies your application for purposes of quota management. Learn how to [get a\n key](/maps/documentation/pollen/get-api-key).\n- `TYPE`: The type of heatmap to return. See [allowed\n values](/maps/documentation/pollen/reference/rest/v1/mapTypes.heatmapTiles/lookupHeatmapTile#maptype).\n- `Z`: Zoom level that determines how large or small the contents of a map appear in a map view. Allowed values are 0-16, where a value of 0 displays the entire world in a single tile.\n- `X`,`Y`: The tile coordinates relatively to the north east corner (0,0). `X` values increase from west to east and `Y` values increase from north to south. Coordinates must be valid for the specified zoom level. For example, if you set the zoom level to 2 and request a tile at coordinates (10,10), the API returns an error.\n\nExample heatmap request\n-----------------------\n\nThe image above shows a `TREE_UPI` heatmap with a zoom level of 2, along with\nthe coordinates of each tile. The following example uses the `heatmapTiles`\nendpoint to request the tile at coordinates (2,1): \n\n```html\nhttps://pollen.googleapis.com/v1/mapTypes/TREE_UPI/heatmapTiles/2/2/1?key=YOUR_API_KEY\n```\n\nThe tile appears as an image that can be overlaid on a map:\n\nFor more information on overlaying tiles on top of the default map, see\n[Overlay Map Types](/maps/documentation/javascript/examples/maptype-overlay)."]]