heatmapTiles 엔드포인트는 타일 오버레이를 통해 꽃가루 관련 히트맵을 제공합니다. 타일 오버레이는 Google 지도 위에 표시할 수 있는 이미지 타일 모음입니다. 각 이미지 타일은 256x256픽셀입니다.
타일 오버레이는 타일 모음으로 조립된 그리드이며 각 타일에는 (X,Y) 좌표가 할당됩니다. 좌표가 (0,0)인 타일은 언제나 지도의 북서쪽 모서리에 있습니다. X 값은 서쪽에서 동쪽으로 갈수록 증가하고 Y 값은 북쪽에서 남쪽으로 갈수록 증가합니다.
zoom level는 지도 뷰에 지도의 콘텐츠가 표시되는 크기를 결정합니다. 타일 그리드 크기는 X 및 Y 좌표를 확대/축소 수준에 따라 지수적으로 조정하여 결정됩니다.
gridSizeX = XzoomLevel
gridSizeY = YzoomLevel
예를 들어 확대/축소 수준이 2인 경우 세계 지도는 4x4 행렬을 사용하여 총 16개의 타일로 표시됩니다.
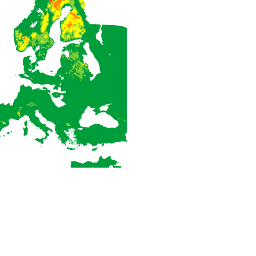
다음 이미지는 확대/축소 수준 2에서 액세스할 수 있는 타일로 구분된 전 세계의 TREE_UPI 히트맵을 보여줍니다.

자세한 내용은 지도 및 타일 좌표를 참고하세요.
다음과 같이 HTTP GET 요청을 전송하여 heatmapTiles 엔드포인트를 사용하여 현재 꽃가루 히트맵 타일을 요청할 수 있습니다.
https://pollen.googleapis.com/v1/mapTypes/TYPE/heatmapTiles/Z/X/Y?key=YOUR_API_KEY
히트맵 엔드포인트 정보
아래에 나열된 모든 매개변수는 요청이 성공하는 데 필요합니다.
KEY: 애플리케이션의 API 키입니다. 이 키는 할당량 관리를 위해 애플리케이션을 식별합니다. 키를 가져오는 방법을 알아보세요.TYPE: 반환할 히트맵 유형입니다. 허용된 값을 참고하세요.Z: 지도 뷰에 지도의 콘텐츠가 얼마나 크게 또는 작게 표시되는지를 결정하는 확대/축소 수준입니다. 허용되는 값은 0~16이며, 값 0은 전체 세계를 하나의 타일에 표시합니다.X,Y: 북동쪽 모서리 (0,0)를 기준으로 한 타일 좌표입니다.X값은 서쪽에서 동쪽으로 갈수록 증가하고Y값은 북쪽에서 남쪽으로 갈수록 증가합니다. 좌표는 지정된 확대/축소 수준에 유효해야 합니다. 예를 들어 확대/축소 수준을 2로 설정하고 좌표 (10,10)에서 타일을 요청하면 API에서 오류를 반환합니다.
히트맵 요청 예시
위 이미지는 확대 수준이 2인 TREE_UPI 히트맵과 각 타일의 좌표를 보여줍니다. 다음 예에서는 heatmapTiles 엔드포인트를 사용하여 좌표 (2,1)의 타일을 요청합니다.
https://pollen.googleapis.com/v1/mapTypes/TREE_UPI/heatmapTiles/2/2/1?key=YOUR_API_KEY
타일은 지도에 오버레이할 수 있는 이미지로 표시됩니다.
기본 지도 위에 타일을 오버레이하는 방법에 관한 자세한 내용은 지도 유형 오버레이를 참고하세요.