Tetap teratur dengan koleksi
Simpan dan kategorikan konten berdasarkan preferensi Anda.
Endpoint
heatmapTiles
menyediakan peta panas terkait serbuk sari melalui overlay ubin. Overlay ubin
adalah kumpulan ubin gambar yang dapat ditampilkan di atas Google Maps. Setiap
petak gambar berukuran 256 x 256 piksel.
Overlay petak adalah petak yang dirakit dari kumpulan petak, yang masing-masing diberi koordinat (X,Y). Ubin dengan koordinat (0,0) selalu berada di sudut barat laut peta. Nilai X bertambah dari barat ke timur, sedangkan nilai Y bertambah dari utara ke selatan.
zoom level menentukan seberapa besar atau kecil konten peta muncul dalam tampilan peta. Ukuran petak ubin ditentukan dengan menskalakan koordinat X dan Y
secara eksponensial berdasarkan tingkat zoom.
gridSizeX = XzoomLevel
gridSizeY = YzoomLevel
Misalnya, pada tingkat zoom 2, peta dunia direpresentasikan menggunakan matriks 4 x 4, dengan total 16 ubin.
Gambar berikut menunjukkan peta panas TREE_UPI seluruh dunia, yang dibagi menjadi ubin yang dapat diakses pada tingkat zoom 2.
Z: Tingkat zoom yang menentukan seberapa besar atau kecil konten peta
tampil di tampilan peta. Nilai yang diizinkan adalah 0-16, dengan nilai 0 menampilkan
seluruh dunia dalam satu petak.
X,Y: Koordinat petak relatif terhadap sudut timur laut (0,0). Nilai X
bertambah dari barat ke timur dan nilai Y bertambah dari utara ke
selatan. Koordinat harus valid untuk tingkat zoom yang ditentukan. Misalnya,
jika Anda menyetel tingkat zoom ke 2 dan meminta petak di koordinat (10,10),
API akan menampilkan error.
Contoh permintaan peta panas
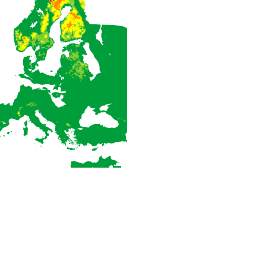
Gambar di atas menunjukkan peta panas TREE_UPI dengan tingkat zoom 2, beserta
koordinat setiap petak. Contoh berikut menggunakan endpoint heatmapTiles
untuk meminta petak di koordinat (2,1):
[[["Mudah dipahami","easyToUnderstand","thumb-up"],["Memecahkan masalah saya","solvedMyProblem","thumb-up"],["Lainnya","otherUp","thumb-up"]],[["Informasi yang saya butuhkan tidak ada","missingTheInformationINeed","thumb-down"],["Terlalu rumit/langkahnya terlalu banyak","tooComplicatedTooManySteps","thumb-down"],["Sudah usang","outOfDate","thumb-down"],["Masalah terjemahan","translationIssue","thumb-down"],["Masalah kode / contoh","samplesCodeIssue","thumb-down"],["Lainnya","otherDown","thumb-down"]],["Terakhir diperbarui pada 2025-08-31 UTC."],[[["\u003cp\u003eThe heatmapTiles endpoint delivers pollen heatmaps as tile overlays, which are collections of 256x256 pixel image tiles displayed on top of Google Maps.\u003c/p\u003e\n"],["\u003cp\u003eTile coordinates (X,Y) determine the grid position, with (0,0) at the northwest corner and increasing values eastward for X and southward for Y.\u003c/p\u003e\n"],["\u003cp\u003eZoom level (Z) controls map content size and grid dimensions, ranging from 0 (entire world) to 16, influencing tile coordinates validity.\u003c/p\u003e\n"],["\u003cp\u003eTo request heatmap tiles, use the heatmapTiles endpoint with required parameters: API key, heatmap type, zoom level, and tile coordinates (X,Y).\u003c/p\u003e\n"],["\u003cp\u003eYou can overlay these pollen heatmap tiles onto existing maps for visualization, enhancing applications with pollen information.\u003c/p\u003e\n"]]],["The `heatmapTiles` endpoint provides pollen heatmaps as image tiles (256x256 pixels) overlaid on Google Maps. Tiles are arranged in a grid with (X,Y) coordinates, starting from (0,0) in the northwest. The zoom level (0-16) dictates map detail, scaling the grid exponentially (gridSizeX = X^zoomLevel). A request to the endpoint requires an API key, heatmap `TYPE`, `Z` zoom level, and `X`, `Y` tile coordinates. The format for a request is: `https://pollen.googleapis.com/v1/mapTypes/TYPE/heatmapTiles/Z/X/Y?key=YOUR_API_KEY`\n"],null,["# Heatmaps\n\nThe\n[heatmapTiles](/maps/documentation/pollen/reference/rest/v1/mapTypes.heatmapTiles/lookupHeatmapTile)\nendpoint provides pollen-related heatmaps through tile overlay. A tile overlay\nis a collection of image tiles that can be displayed on top of Google Maps. Each\nimage tile is 256 x 256 pixels.\n\nThe tile overlay is a grid assembled from a collection of tiles, each assigned\n(`X`,`Y`) coordinates. The tile with coordinates (0,0) is always at the\nnorthwest corner of the map. The `X` values increase from west to east, while\nthe `Y` values increase from north to south.\n\nThe `zoom level` determines how large or small the contents of a map appear in a\nmap view. The tile grid size is determined by scaling the `X` and `Y`\ncoordinates exponentially by the zoom level. \n\n```text\ngridSizeX = XzoomLevel\ngridSizeY = YzoomLevel\n```\n\nFor example, at a zoom level of 2, the world map is represented using a 4 x 4\nmatrix, for a total of 16 tiles.\n\nThe following image shows a `TREE_UPI` heatmap of the entire world, sectioned\ninto tiles that can be accessed at a zoom level of 2.\n\nSee [Map and Tile\ncoordinates](/maps/documentation/javascript/coordinates#tile-coordinates) for\nadditional details.\n\nYou can request current pollen heatmap tiles using the [heatmapTiles](/maps/documentation/pollen/reference/rest/v1/mapTypes.heatmapTiles/lookupHeatmapTile)\nendpoint by sending an HTTP GET request to: \n\n```html\nhttps://pollen.googleapis.com/v1/mapTypes/TYPE/heatmapTiles/Z/X/Y?key=YOUR_API_KEY\n```\n\nAbout the heatmap endpoint\n--------------------------\n\nAll parameters listed below are required for a successful request:\n\n- `KEY`: Your application's API key. This key identifies your application for purposes of quota management. Learn how to [get a\n key](/maps/documentation/pollen/get-api-key).\n- `TYPE`: The type of heatmap to return. See [allowed\n values](/maps/documentation/pollen/reference/rest/v1/mapTypes.heatmapTiles/lookupHeatmapTile#maptype).\n- `Z`: Zoom level that determines how large or small the contents of a map appear in a map view. Allowed values are 0-16, where a value of 0 displays the entire world in a single tile.\n- `X`,`Y`: The tile coordinates relatively to the north east corner (0,0). `X` values increase from west to east and `Y` values increase from north to south. Coordinates must be valid for the specified zoom level. For example, if you set the zoom level to 2 and request a tile at coordinates (10,10), the API returns an error.\n\nExample heatmap request\n-----------------------\n\nThe image above shows a `TREE_UPI` heatmap with a zoom level of 2, along with\nthe coordinates of each tile. The following example uses the `heatmapTiles`\nendpoint to request the tile at coordinates (2,1): \n\n```html\nhttps://pollen.googleapis.com/v1/mapTypes/TREE_UPI/heatmapTiles/2/2/1?key=YOUR_API_KEY\n```\n\nThe tile appears as an image that can be overlaid on a map:\n\nFor more information on overlaying tiles on top of the default map, see\n[Overlay Map Types](/maps/documentation/javascript/examples/maptype-overlay)."]]