Organiza tus páginas con colecciones
Guarda y categoriza el contenido según tus preferencias.
El extremo heatmapTiles proporciona mapas de calor relacionados con el polen a través de una superposición de mosaicos. Una superposición de mosaicos es un conjunto de mosaicos de imágenes que se pueden mostrar sobre Google Maps. Cada mosaico de imagen es de 256 x 256 píxeles.
La superposición de mosaicos es una cuadrícula ensamblada a partir de una colección de mosaicos, a cada uno de los cuales se le asignan coordenadas (X,Y). El mosaico con coordenadas (0,0) siempre se encuentra en la esquina noroeste del mapa. Los valores de X aumentan de oeste a este, mientras que los valores de Y aumentan de norte a sur.
El zoom level determina qué tan grande o pequeño aparece el contenido de un mapa en una vista del mapa. El tamaño de la cuadrícula de mosaicos se determina escalando las coordenadas X y Y de forma exponencial según el nivel de zoom.
gridSizeX = XzoomLevel
gridSizeY = YzoomLevel
Por ejemplo, en un nivel de zoom de 2, el mapa mundial se representa con una matriz de 4 x 4, lo que da un total de 16 mosaicos.
En la siguiente imagen, se muestra un mapa de calor de TREE_UPI de todo el mundo, seccionado en mosaicos a los que se puede acceder con un nivel de zoom de 2.
Todos los parámetros que se indican a continuación son obligatorios para que la solicitud se realice correctamente:
KEY: Es la clave de API de tu aplicación. Esta clave identifica tu aplicación para la administración de cuotas. Obtén más información para obtener una clave.
TYPE: Es el tipo de mapa de calor que se devolverá. Consulta los valores permitidos.
Z: Es el nivel de zoom que determina qué tan grande o pequeño aparece el contenido de un mapa en una vista del mapa. Los valores permitidos son del 0 al 16, donde el valor 0 muestra el mundo entero en un solo mosaico.
X,Y: Son las coordenadas de la segmentación en relación con la esquina noreste (0,0). Los valores de X aumentan de oeste a este, y los de Y, de norte a sur. Las coordenadas deben ser válidas para el nivel de zoom especificado. Por ejemplo, si estableces el nivel de zoom en 2 y solicitas una segmentación en las coordenadas (10,10), la API devolverá un error.
Ejemplo de solicitud de mapa de calor
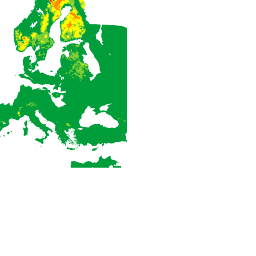
La imagen anterior muestra un mapa de calor de TREE_UPI con un nivel de zoom de 2, junto con las coordenadas de cada segmento. En el siguiente ejemplo, se usa el extremo heatmapTiles para solicitar la segmentación en las coordenadas (2,1):
[[["Fácil de comprender","easyToUnderstand","thumb-up"],["Resolvió mi problema","solvedMyProblem","thumb-up"],["Otro","otherUp","thumb-up"]],[["Falta la información que necesito","missingTheInformationINeed","thumb-down"],["Muy complicado o demasiados pasos","tooComplicatedTooManySteps","thumb-down"],["Desactualizado","outOfDate","thumb-down"],["Problema de traducción","translationIssue","thumb-down"],["Problema con las muestras o los códigos","samplesCodeIssue","thumb-down"],["Otro","otherDown","thumb-down"]],["Última actualización: 2025-08-31 (UTC)"],[[["\u003cp\u003eThe heatmapTiles endpoint delivers pollen heatmaps as tile overlays, which are collections of 256x256 pixel image tiles displayed on top of Google Maps.\u003c/p\u003e\n"],["\u003cp\u003eTile coordinates (X,Y) determine the grid position, with (0,0) at the northwest corner and increasing values eastward for X and southward for Y.\u003c/p\u003e\n"],["\u003cp\u003eZoom level (Z) controls map content size and grid dimensions, ranging from 0 (entire world) to 16, influencing tile coordinates validity.\u003c/p\u003e\n"],["\u003cp\u003eTo request heatmap tiles, use the heatmapTiles endpoint with required parameters: API key, heatmap type, zoom level, and tile coordinates (X,Y).\u003c/p\u003e\n"],["\u003cp\u003eYou can overlay these pollen heatmap tiles onto existing maps for visualization, enhancing applications with pollen information.\u003c/p\u003e\n"]]],["The `heatmapTiles` endpoint provides pollen heatmaps as image tiles (256x256 pixels) overlaid on Google Maps. Tiles are arranged in a grid with (X,Y) coordinates, starting from (0,0) in the northwest. The zoom level (0-16) dictates map detail, scaling the grid exponentially (gridSizeX = X^zoomLevel). A request to the endpoint requires an API key, heatmap `TYPE`, `Z` zoom level, and `X`, `Y` tile coordinates. The format for a request is: `https://pollen.googleapis.com/v1/mapTypes/TYPE/heatmapTiles/Z/X/Y?key=YOUR_API_KEY`\n"],null,["# Heatmaps\n\nThe\n[heatmapTiles](/maps/documentation/pollen/reference/rest/v1/mapTypes.heatmapTiles/lookupHeatmapTile)\nendpoint provides pollen-related heatmaps through tile overlay. A tile overlay\nis a collection of image tiles that can be displayed on top of Google Maps. Each\nimage tile is 256 x 256 pixels.\n\nThe tile overlay is a grid assembled from a collection of tiles, each assigned\n(`X`,`Y`) coordinates. The tile with coordinates (0,0) is always at the\nnorthwest corner of the map. The `X` values increase from west to east, while\nthe `Y` values increase from north to south.\n\nThe `zoom level` determines how large or small the contents of a map appear in a\nmap view. The tile grid size is determined by scaling the `X` and `Y`\ncoordinates exponentially by the zoom level. \n\n```text\ngridSizeX = XzoomLevel\ngridSizeY = YzoomLevel\n```\n\nFor example, at a zoom level of 2, the world map is represented using a 4 x 4\nmatrix, for a total of 16 tiles.\n\nThe following image shows a `TREE_UPI` heatmap of the entire world, sectioned\ninto tiles that can be accessed at a zoom level of 2.\n\nSee [Map and Tile\ncoordinates](/maps/documentation/javascript/coordinates#tile-coordinates) for\nadditional details.\n\nYou can request current pollen heatmap tiles using the [heatmapTiles](/maps/documentation/pollen/reference/rest/v1/mapTypes.heatmapTiles/lookupHeatmapTile)\nendpoint by sending an HTTP GET request to: \n\n```html\nhttps://pollen.googleapis.com/v1/mapTypes/TYPE/heatmapTiles/Z/X/Y?key=YOUR_API_KEY\n```\n\nAbout the heatmap endpoint\n--------------------------\n\nAll parameters listed below are required for a successful request:\n\n- `KEY`: Your application's API key. This key identifies your application for purposes of quota management. Learn how to [get a\n key](/maps/documentation/pollen/get-api-key).\n- `TYPE`: The type of heatmap to return. See [allowed\n values](/maps/documentation/pollen/reference/rest/v1/mapTypes.heatmapTiles/lookupHeatmapTile#maptype).\n- `Z`: Zoom level that determines how large or small the contents of a map appear in a map view. Allowed values are 0-16, where a value of 0 displays the entire world in a single tile.\n- `X`,`Y`: The tile coordinates relatively to the north east corner (0,0). `X` values increase from west to east and `Y` values increase from north to south. Coordinates must be valid for the specified zoom level. For example, if you set the zoom level to 2 and request a tile at coordinates (10,10), the API returns an error.\n\nExample heatmap request\n-----------------------\n\nThe image above shows a `TREE_UPI` heatmap with a zoom level of 2, along with\nthe coordinates of each tile. The following example uses the `heatmapTiles`\nendpoint to request the tile at coordinates (2,1): \n\n```html\nhttps://pollen.googleapis.com/v1/mapTypes/TREE_UPI/heatmapTiles/2/2/1?key=YOUR_API_KEY\n```\n\nThe tile appears as an image that can be overlaid on a map:\n\nFor more information on overlaying tiles on top of the default map, see\n[Overlay Map Types](/maps/documentation/javascript/examples/maptype-overlay)."]]