PLACES_COUNT_PER_GEO işlevi, aranacak coğrafi alan dizisini alır ve alan başına yer sayısı tablosunu döndürür. Örneğin, arama alanı olarak bir posta kodu dizisi belirtirseniz yanıtta her posta kodu için ayrı bir satır içeren bir tablo yer alır.
PLACES_COUNT_PER_GEO işlevi tablo döndürdüğünden, FROM ifadesiyle çağırın.
Giriş parametreleri:
Zorunlu: Arama alanını belirten
geographiesfiltre parametresi.geographiesparametresi, noktaları, çizgi dizilerini ve poligonları destekleyen BigQueryGEOGRAPHYveri türü tarafından tanımlanan bir değer dizisi alır.İsteğe bağlı: Aramanızı daraltmak için ek filtre parametreleri.
Şunu döndürür:
- Her coğrafi alan için bir satır içeren bir tablo. Tabloda
geography(GEOGRAPHY),count(INT64) veplace_ids(ARRAY<STRING>) sütunları bulunur.place_idssütunu, her coğrafi alan için en fazla 250 yer kimliği içerir.
- Her coğrafi alan için bir satır içeren bir tablo. Tabloda
Örnek: New York City'nin her ilçesindeki restoran sayısını hesaplama
Bu örnek, New York City'deki her ilçede faaliyet gösteren restoranların sayılarının yer aldığı bir tablo oluşturur.
Bu örnekte, New York City'deki üç ilçenin (Queens, Kings, New York) sınırlarını almak için United States Census Bureau
Data BigQuery herkese açık veri kümesi kullanılır. Her ilçenin sınırları county_geom sütununda yer alır.
Bu örnekte, county_geom'nin basitleştirilmiş bir sürümünü döndürmek için BigQuery
ST_SIMPLIFY
işlevi kullanılır. ST_SIMPLIFY işlevi, neredeyse düz kenar zincirlerini tek bir uzun kenarla değiştirir.
DECLARE geos ARRAY<GEOGRAPHY>;

SET geos = (SELECT ARRAY_AGG(ST_SIMPLIFY(county_geom, 100))
            FROM `bigquery-public-data.geo_us_boundaries.counties`
            WHERE county_name IN ("Queens","Kings", "New York") AND state_fips_code = "36");

SELECT * FROM `PROJECT_NAME.places_insights___us.PLACES_COUNT_PER_GEO`(
  JSON_OBJECT(
      'geographies', geos,
      'types', ["restaurant"],
      'business_status', ["OPERATIONAL"]
      )
);
İşlevin yanıtı:
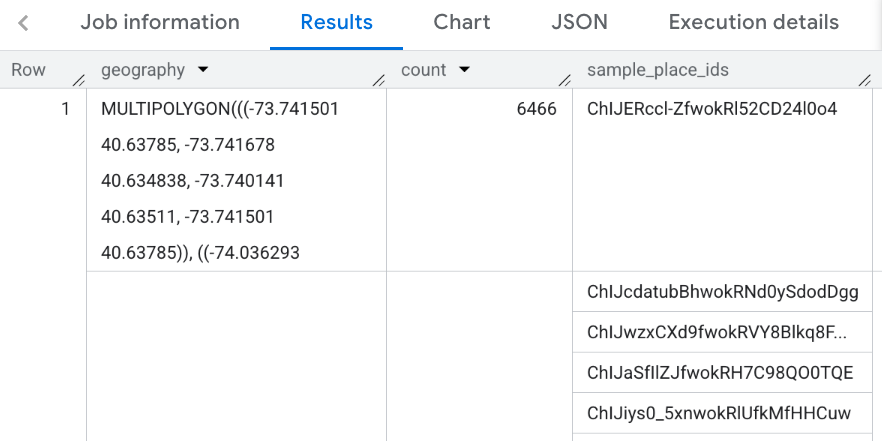
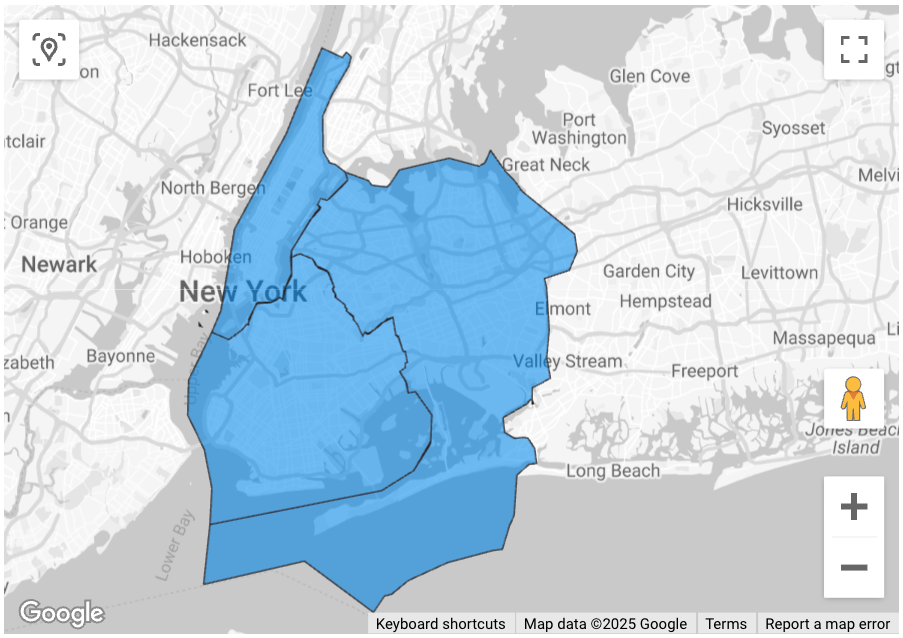
Sonuçları görselleştirme
Aşağıdaki resimlerde, her ilçenin ana hattı da dahil olmak üzere bu verilerin Looker Studio'da dolu bir harita olarak gösterildiği görülmektedir:
Verilerinizi Looker Studio'ya aktarmak için:
Sonuçları oluşturmak için yukarıdaki işlevi çalıştırın.
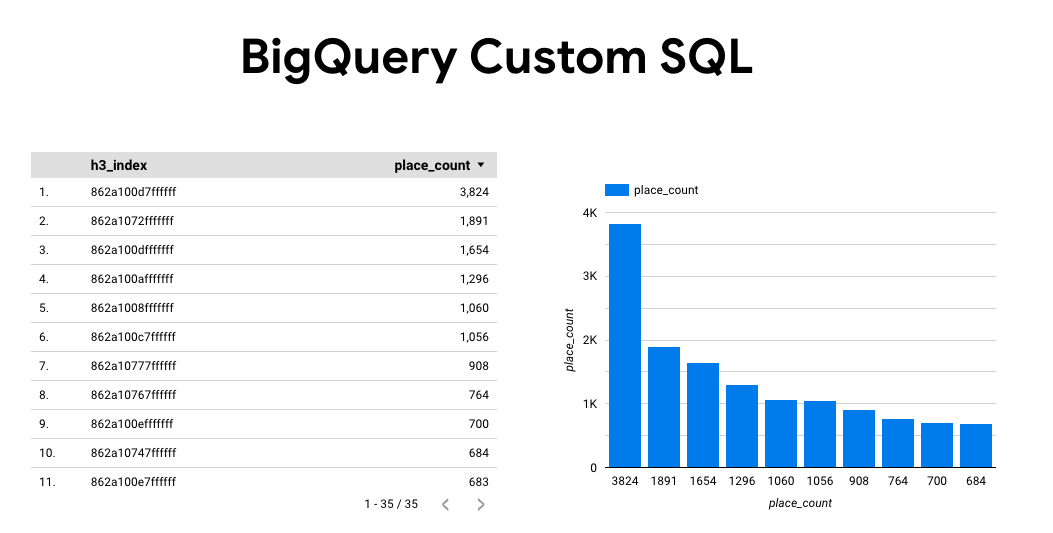
BigQuery sonuçlarında Open in -> Looker Studio'yu (Şurada aç: Looker Studio) tıklayın. Sonuçlarınız otomatik olarak Looker Studio'ya aktarılır.
Looker Studio, varsayılan bir rapor sayfası oluşturur ve bu sayfayı sonuçların başlığı, tablosu ve çubuk grafiğiyle başlatır.
Sayfadaki her şeyi seçip silin.
Raporunuza dolu harita eklemek için Ekle -> Dolu harita'yı tıklayın.
Grafik türleri -> Kurulum bölümünde alanları aşağıda gösterildiği gibi yapılandırın:
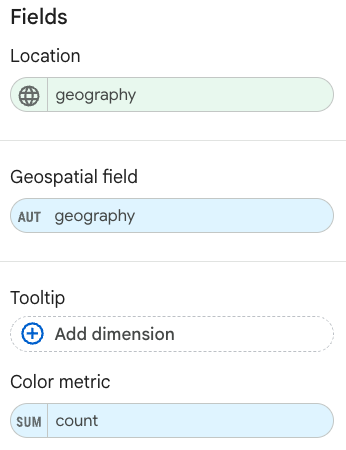
Doldurulmuş harita yukarıdaki gibi görünür. Haritanın görünümünü daha da yapılandırmak için isteğe bağlı olarak Grafik türleri -> Stiller'i seçebilirsiniz.
Yer İşletmeleri Analizleri sonuçlarını görselleştirme hakkında daha fazla bilgi ve örnek için Sorgu sonuçlarını görselleştirme başlıklı makaleyi inceleyin.