Funkcja PLACES_COUNT_PER_GEO przyjmuje tablicę obszarów geograficznych do wyszukania i zwraca tabelę z liczbą miejsc w każdym obszarze. Jeśli na przykład jako obszar wyszukiwania określisz tablicę kodów pocztowych, odpowiedź będzie zawierać tabelę z osobnym wierszem dla każdego kodu pocztowego.
Funkcja PLACES_COUNT_PER_GEO zwraca tabelę, więc wywołaj ją za pomocą klauzuli FROM.
Parametry wejściowe:
Wymagany:
geographiesparametr filtra, który określa obszar wyszukiwania. Parametrgeographiesprzyjmuje tablicę wartości zdefiniowanych przez typ danych BigQueryGEOGRAPHY, który obsługuje punkty, linie i wielokąty.Opcjonalnie: dodatkowe parametry filtra, które pozwalają zawęzić wyszukiwanie.
Zwraca:
- Tabela z jednym wierszem na obszar geograficzny. Tabela zawiera kolumny
geography(GEOGRAPHY),count(INT64) iplace_ids(ARRAY<STRING>), przy czym kolumnaplace_idszawiera maksymalnie 250 identyfikatorów miejsc w przypadku każdego obszaru geograficznego.
- Tabela z jednym wierszem na obszar geograficzny. Tabela zawiera kolumny
Przykład: obliczanie liczby restauracji w każdym hrabstwie Nowego Jorku
Ten przykład generuje tabelę z liczbą działających restauracji w poszczególnych hrabstwach w Nowym Jorku.
W tym przykładzie używamy danych z U.S. Census Bureau, które są publicznym zbiorem danych BigQuery, aby uzyskać granice 3 okręgów w Nowym Jorku: „Queens”, „Kings” i „New York”. Granice każdego hrabstwa znajdują się w kolumnie county_geom.
W tym przykładzie używana jest funkcja BigQuery
ST_SIMPLIFY
do zwracania uproszczonej wersji funkcji county_geom. Funkcja ST_SIMPLIFY
zastępuje prawie proste łańcuchy krawędzi jedną długą krawędzią.
DECLARE geos ARRAY<GEOGRAPHY>;

SET geos = (SELECT ARRAY_AGG(ST_SIMPLIFY(county_geom, 100))
            FROM `bigquery-public-data.geo_us_boundaries.counties`
            WHERE county_name IN ("Queens","Kings", "New York") AND state_fips_code = "36");

SELECT * FROM `PROJECT_NAME.places_insights___us.PLACES_COUNT_PER_GEO`(
  JSON_OBJECT(
      'geographies', geos,
      'types', ["restaurant"],
      'business_status', ["OPERATIONAL"]
      )
);
Odpowiedź funkcji:
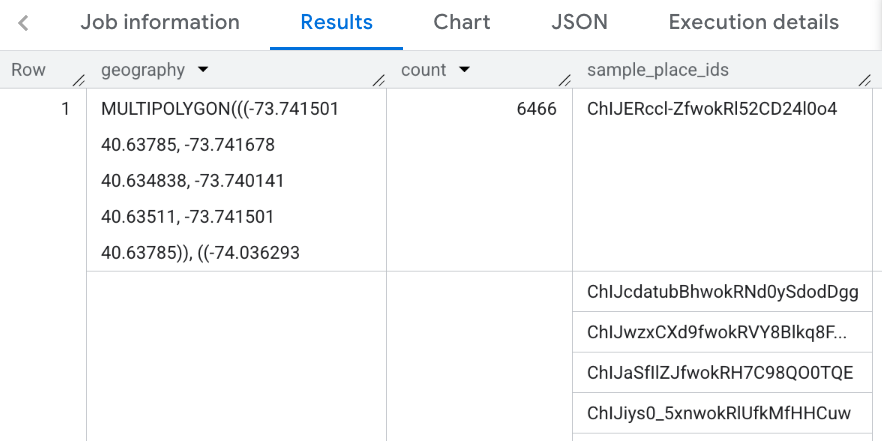
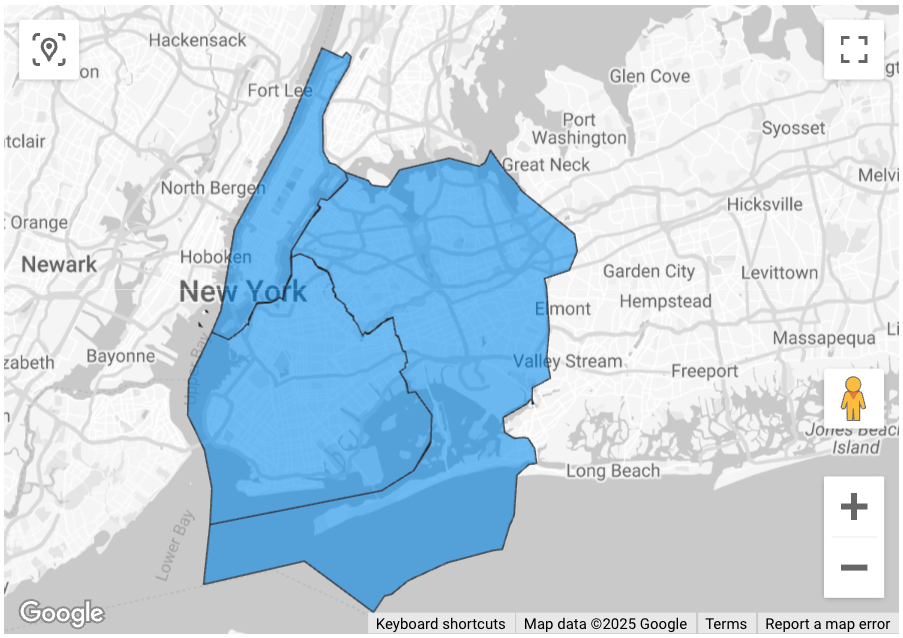
Wizualizacja wyników
Na ilustracjach poniżej widać te dane wyświetlane w Looker Studio jako mapa wypełniona kolorem, z obrysem każdego hrabstwa:
Aby zaimportować dane do Looker Studio:
Uruchom powyższą funkcję, aby wygenerować wyniki.
W wynikach BigQuery kliknij Otwórz w –> Looker Studio. Wyniki są automatycznie importowane do Looker Studio.
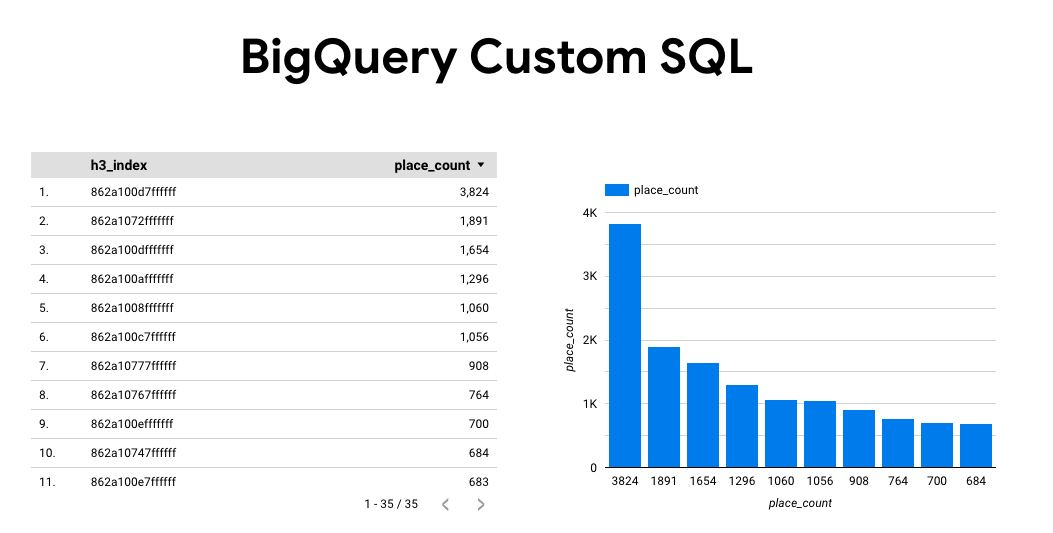
Looker Studio tworzy domyślną stronę raportu i inicjuje ją za pomocą tytułu, tabeli i wykresu słupkowego wyników.
Zaznacz wszystko na stronie i usuń.
Aby dodać do raportu mapę wypełnioną, kliknij Wstaw –> Mapa wypełniona.
W sekcji Typy wykresów –> Konfiguracja skonfiguruj pola w sposób pokazany poniżej:
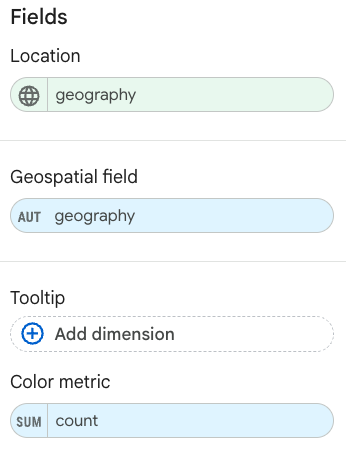
Wypełniona mapa będzie wyglądać jak powyżej. Opcjonalnie możesz kliknąć Typy wykresów –> Style, aby dodatkowo skonfigurować wygląd mapy.
Więcej informacji i przykłady wizualizacji wyników Places Insights znajdziesz w artykule Wizualizacja wyników zapytania.