הפונקציה PLACES_COUNT_PER_GEO מקבלת מערך של אזורים גיאוגרפיים לחיפוש ומחזירה טבלה של ספירת המקומות בכל אזור. לדוגמה, אם מציינים מערך של אזורי מיקוד כאזור החיפוש, התגובה מכילה טבלה עם שורה נפרדת לכל אזור מיקוד.
הפונקציה PLACES_COUNT_PER_GEO מחזירה טבלה, ולכן צריך לקרוא לה באמצעות פסקה FROM.
פרמטרים של קלט:
חובה:
geographiesפרמטר המסנן שמציין את אזור החיפוש. הפרמטרgeographiesמקבל מערך של ערכים שמוגדרים על ידי סוג הנתוניםGEOGRAPHYשל BigQuery, שתומך בנקודות, בקווי פוליגון ובפוליגונים.אופציונלי: פרמטרים נוספים של מסנן לצמצום החיפוש.
החזרות:
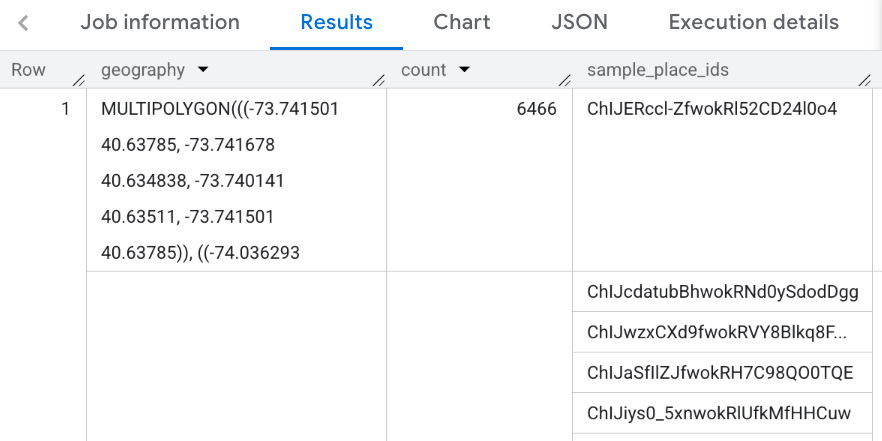
- טבלה עם שורה אחת לכל אזור גיאוגרפי. הטבלה מכילה את העמודות
geography(GEOGRAPHY), count(INT64) ו-place_ids(ARRAY<STRING>), כאשרplace_idsמכילה עד 250 מזהי מקומות לכל אזור גיאוגרפי.
- טבלה עם שורה אחת לכל אזור גיאוגרפי. הטבלה מכילה את העמודות
דוגמה: חישוב מספר המסעדות בכל מחוז בעיר ניו יורק
בדוגמה הזו נוצרת טבלה עם נתוני ספירה של מסעדות פעילות בכל מחוז בניו יורק.
בדוגמה הזו נעשה שימוש בנתונים של לשכת מפקד האוכלוסין של ארצות הברית, מערך נתונים ציבורי ב-BigQuery, כדי לקבל את הגבולות של שלושת המחוזות בעיר ניו יורק: Queens, Kings ו-New York. הגבולות של כל מחוז מופיעים בעמודה county_geom.
בדוגמה הזו נעשה שימוש בפונקציה BigQuery
ST_SIMPLIFY
כדי להחזיר גרסה פשוטה של county_geom. הפונקציה ST_SIMPLIFY
מחליפה שרשראות קצרות של קצוות כמעט ישרים בקצה ארוך אחד.
DECLARE geos ARRAY<GEOGRAPHY>;

SET geos = (SELECT ARRAY_AGG(ST_SIMPLIFY(county_geom, 100))
            FROM `bigquery-public-data.geo_us_boundaries.counties`
            WHERE county_name IN ("Queens","Kings", "New York") AND state_fips_code = "36");

SELECT * FROM `PROJECT_NAME.places_insights___us.PLACES_COUNT_PER_GEO`(
  JSON_OBJECT(
      'geographies', geos,
      'types', ["restaurant"],
      'business_status', ["OPERATIONAL"]
      )
);
התגובה של הפונקציה:
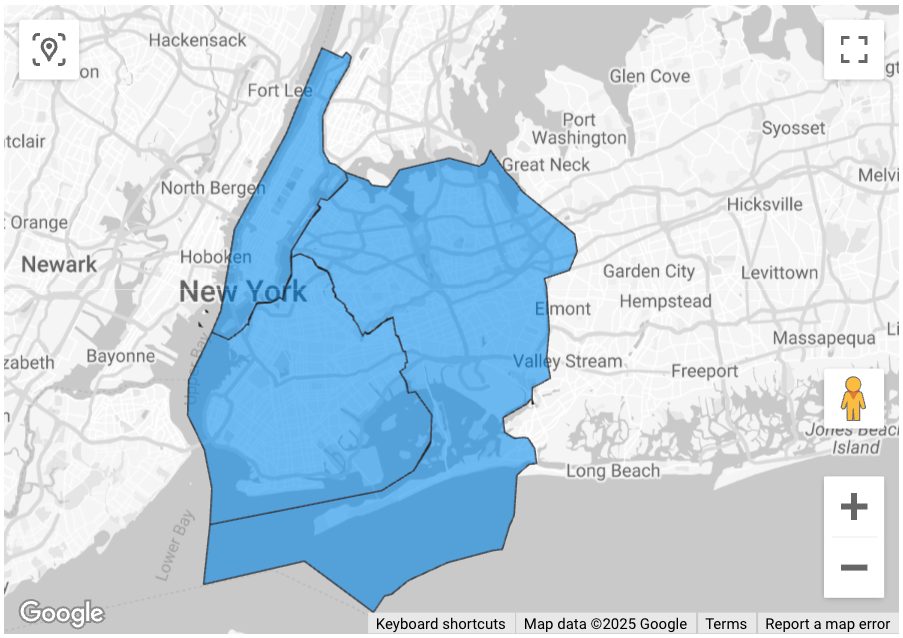
הצגה חזותית של התוצאות
בתמונות הבאות מוצגים הנתונים האלה ב-Looker Studio כמפה עם צבעים, כולל קווי המתאר של כל מחוז:
כדי לייבא את הנתונים ל-Looker Studio:
מריצים את הפונקציה שלמעלה כדי ליצור את התוצאות.
בתוצאות של BigQuery, לוחצים על Open in -> Looker Studio (פתיחה ב-Looker Studio). התוצאות מיובאות אוטומטית ל-Looker Studio.
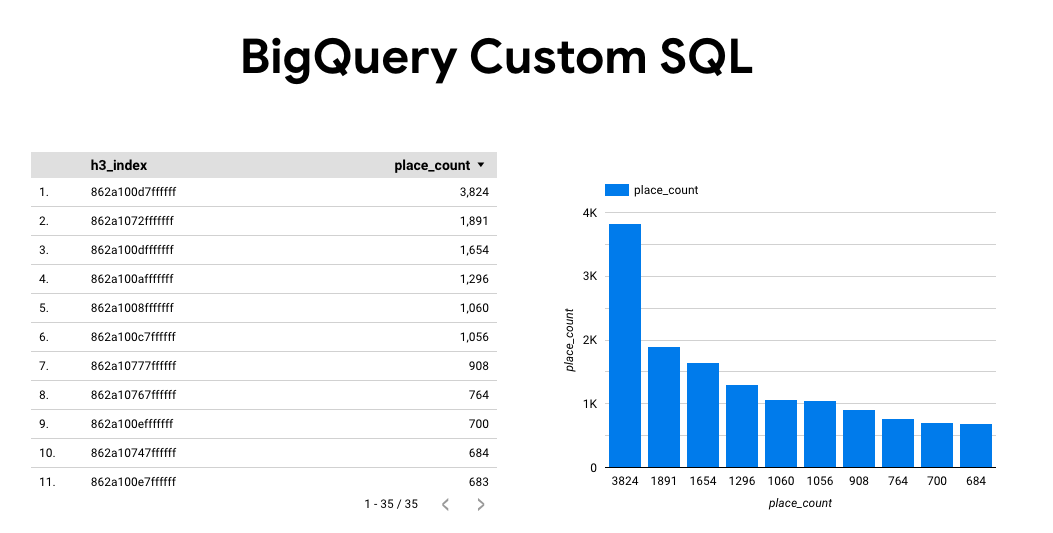
מערכת Looker Studio יוצרת דף דוח שמוגדר כברירת מחדל ומאכלסת אותו בכותרת, בטבלה ובתרשים עמודות של התוצאות.
בוחרים את כל מה שבדף ומוחקים אותו.
כדי להוסיף מפה עם מילוי לדוח, לוחצים על הוספה -> מפה עם מילוי.
בקטע Chart types -> Setup (סוגי תרשימים -> הגדרה), מגדירים את השדות כמו שמוצג בהמשך::
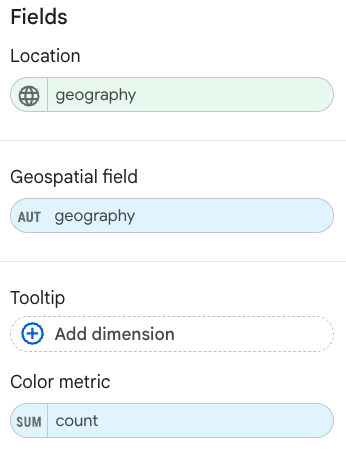
המפה המלאה תיראה כמו בתמונה שלמעלה. אפשר גם לבחור באפשרות סוגי תרשימים -> סגנונות כדי להגדיר עוד את המראה של המפה.
מידע נוסף ודוגמה להדמיה של תוצאות התובנות על מקומות זמינים במאמר בנושא הדמיה של תוצאות שאילתות.