Hàm PLACES_COUNT_PER_GEO lấy một mảng các khu vực địa lý để tìm kiếm và trả về một bảng số lượng địa điểm theo từng khu vực. Ví dụ: nếu bạn chỉ định một mảng mã bưu chính làm khu vực tìm kiếm, thì phản hồi sẽ chứa một bảng có một hàng riêng cho từng mã bưu chính.
Vì hàm PLACES_COUNT_PER_GEO trả về một bảng, hãy gọi hàm này bằng mệnh đề FROM.
Tham số đầu vào:
Bắt buộc: Tham số bộ lọc
geographieschỉ định khu vực tìm kiếm. Tham sốgeographiesnhận một mảng giá trị do loại dữ liệu BigQueryGEOGRAPHYxác định, hỗ trợ các điểm, chuỗi đường và đa giác.Không bắt buộc: Các thông số bộ lọc bổ sung để tinh chỉnh nội dung tìm kiếm.
Trả về:
- Một bảng có một hàng cho mỗi khu vực địa lý. Bảng này chứa các cột
geography(GEOGRAPHY),count(INT64) vàplace_ids(ARRAY<STRING>), trong đóplace_idschứa tối đa 250 mã địa điểm cho mỗi khu vực địa lý.
- Một bảng có một hàng cho mỗi khu vực địa lý. Bảng này chứa các cột
Ví dụ: Tính số lượng nhà hàng ở mỗi quận của Thành phố New York
Ví dụ này tạo ra một bảng số lượng nhà hàng đang hoạt động theo quận ở Thành phố New York.
Ví dụ này sử dụng Dữ liệu của Cục Thống kê Dân số Hoa Kỳ tập dữ liệu công khai BigQuery để lấy ranh giới của 3 quận ở Thành phố New York: "Queens","Kings", "New York". Ranh giới của mỗi quận nằm trong cột county_geom.
Sau đó, ví dụ này sử dụng hàm BigQuery ST_SIMPLIFY để trả về phiên bản đơn giản của county_geom. Hàm ST_SIMPLIFY thay thế các chuỗi cạnh gần như thẳng bằng một cạnh dài duy nhất.
DECLARE geos ARRAY<GEOGRAPHY>;

SET geos = (SELECT ARRAY_AGG(ST_SIMPLIFY(county_geom, 100))
            FROM `bigquery-public-data.geo_us_boundaries.counties`
            WHERE county_name IN ("Queens","Kings", "New York") AND state_fips_code = "36");

SELECT * FROM `PROJECT_NAME.places_insights___us.PLACES_COUNT_PER_GEO`(
  JSON_OBJECT(
      'geographies', geos,
      'types', ["restaurant"],
      'business_status', ["OPERATIONAL"]
      )
);
Phản hồi cho hàm:
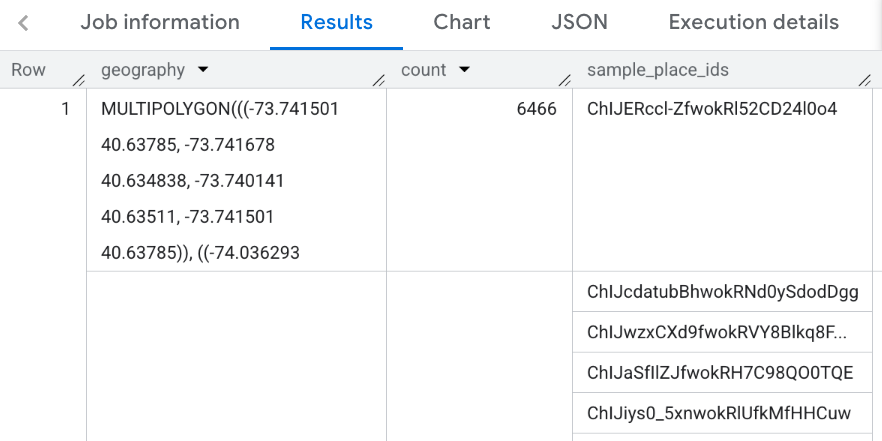
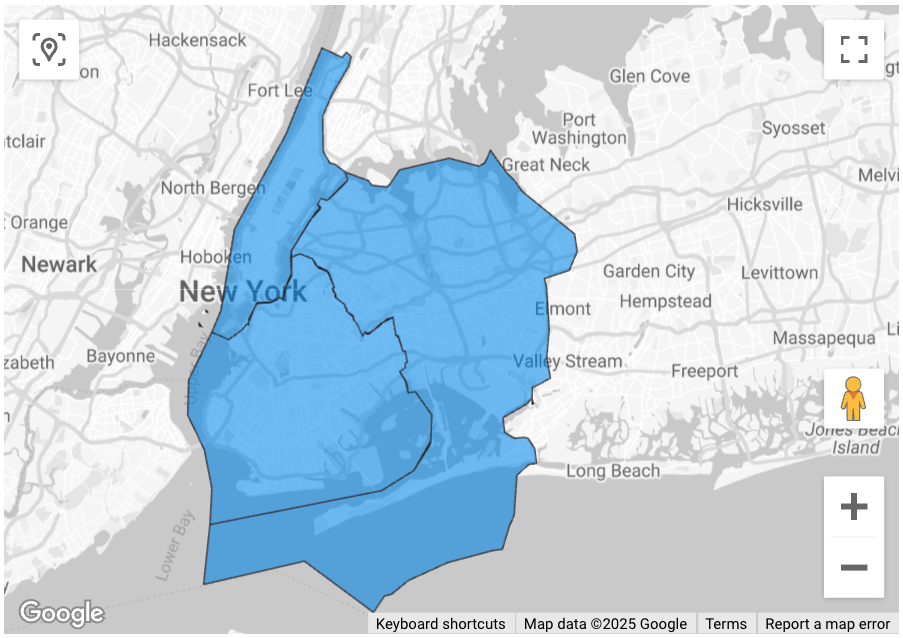
Hình dung kết quả
Các hình ảnh sau đây cho thấy dữ liệu này được hiển thị trong Looker Studio dưới dạng bản đồ được tô màu, bao gồm cả đường viền của từng quận:
Cách nhập dữ liệu vào Looker Studio:
Chạy hàm ở trên để tạo kết quả.
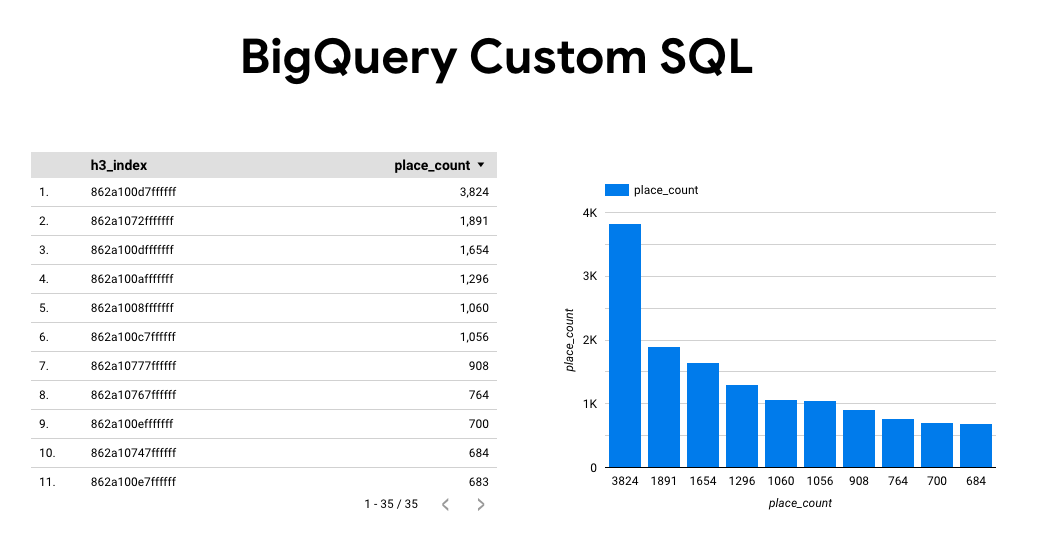
Trong kết quả BigQuery, hãy nhấp vào Mở trong -> Looker Studio. Kết quả của bạn sẽ tự động được nhập vào Looker Studio.
Looker Studio tạo một trang báo cáo mặc định và khởi chạy trang đó bằng tiêu đề, bảng và biểu đồ thanh về kết quả.
Chọn mọi nội dung trên trang rồi xoá.
Nhấp vào Chèn -> Bản đồ tô màu để thêm bản đồ tô màu vào báo cáo.
Trong mục Loại biểu đồ -> Thiết lập, hãy định cấu hình các trường như minh hoạ dưới đây:
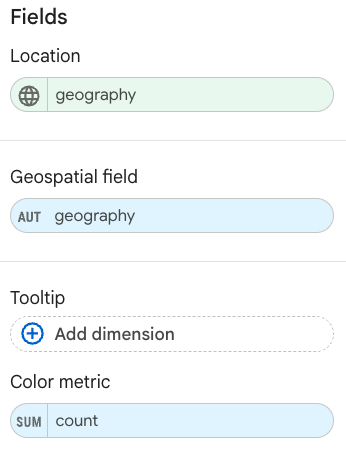
Bản đồ đã điền sẽ xuất hiện như trên. Bạn có thể chọn Loại biểu đồ -> Kiểu (không bắt buộc) để định cấu hình thêm giao diện của bản đồ.
Để biết thêm thông tin và ví dụ về cách trực quan hoá kết quả của Thông tin chi tiết về địa điểm, hãy xem phần Trực quan hoá kết quả truy vấn.