Fungsi PLACES_COUNT_PER_GEO mengambil array area geografis untuk ditelusuri
dan menampilkan tabel jumlah tempat per area. Misalnya, jika Anda menentukan
array kode pos sebagai area penelusuran, respons akan berisi tabel dengan
baris terpisah untuk setiap kode pos.
Karena fungsi PLACES_COUNT_PER_GEO menampilkan tabel, panggil fungsi tersebut menggunakan
klausa FROM.
Parameter input:
Wajib:
geographiesParameter filter yang menentukan area penelusuran. Parametergeographiesmengambil array nilai yang ditentukan oleh jenis dataGEOGRAPHYBigQuery, yang mendukung titik, linestring, dan poligon.Opsional: Parameter filter tambahan untuk menyaring penelusuran Anda.
Retur:
- Tabel dengan satu baris per area geografis. Tabel berisi kolom
geography(GEOGRAPHY),count(INT64), danplace_ids(ARRAY<STRING>) denganplace_idsberisi hingga 250 ID tempat untuk setiap area geografis.
- Tabel dengan satu baris per area geografis. Tabel berisi kolom
Contoh: Hitung jumlah restoran di setiap county di New York City
Contoh ini membuat tabel jumlah restoran operasional per wilayah di New York City.
Contoh ini menggunakan set data publik BigQuery Data Biro Sensus Amerika Serikat untuk mendapatkan batas tiga wilayah di New York City: "Queens","Kings", "New York". Batas setiap county terdapat di kolom county_geom.
Contoh ini kemudian menggunakan fungsi
ST_SIMPLIFY
BigQuery untuk menampilkan versi county_geom yang disederhanakan. Fungsi ST_SIMPLIFY
menggantikan rantai tepi yang hampir lurus dengan satu tepi panjang.
DECLARE geos ARRAY<GEOGRAPHY>;

SET geos = (SELECT ARRAY_AGG(ST_SIMPLIFY(county_geom, 100))
            FROM `bigquery-public-data.geo_us_boundaries.counties`
            WHERE county_name IN ("Queens","Kings", "New York") AND state_fips_code = "36");

SELECT * FROM `PROJECT_NAME.places_insights___us.PLACES_COUNT_PER_GEO`(
  JSON_OBJECT(
      'geographies', geos,
      'types', ["restaurant"],
      'business_status', ["OPERATIONAL"]
      )
);
Respons untuk fungsi:
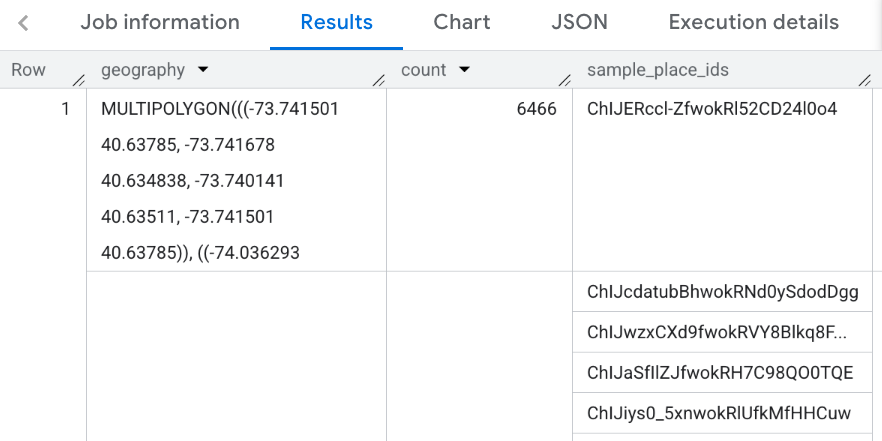
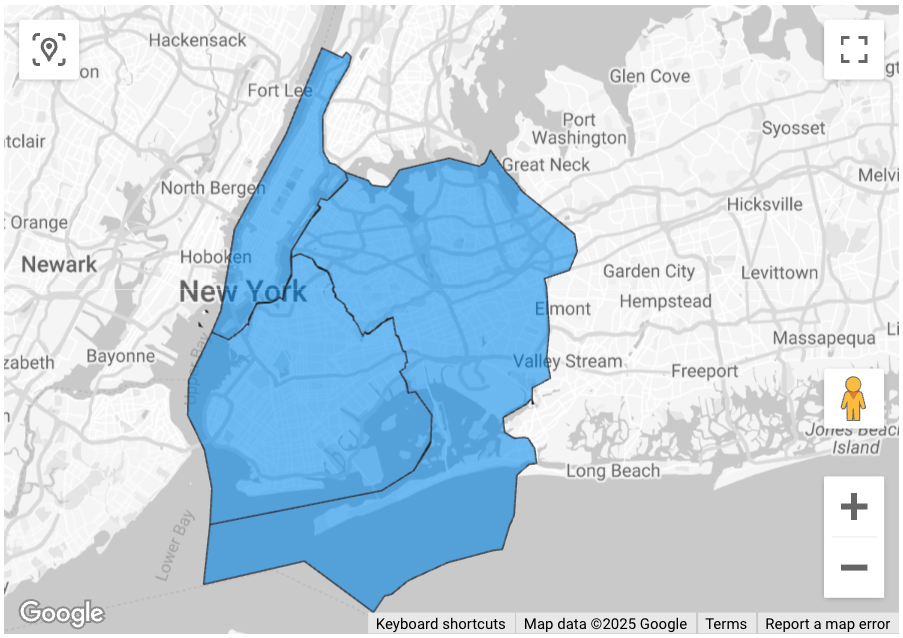
Memvisualisasikan hasil
Gambar berikut menampilkan data ini yang ditampilkan di Looker Studio sebagai peta isian, termasuk garis batas setiap wilayah:
Untuk mengimpor data Anda ke Looker Studio:
Jalankan fungsi di atas untuk menghasilkan hasil.
Di hasil BigQuery, klik Open in -> Looker Studio. Hasil Anda akan otomatis diimpor ke Looker Studio.
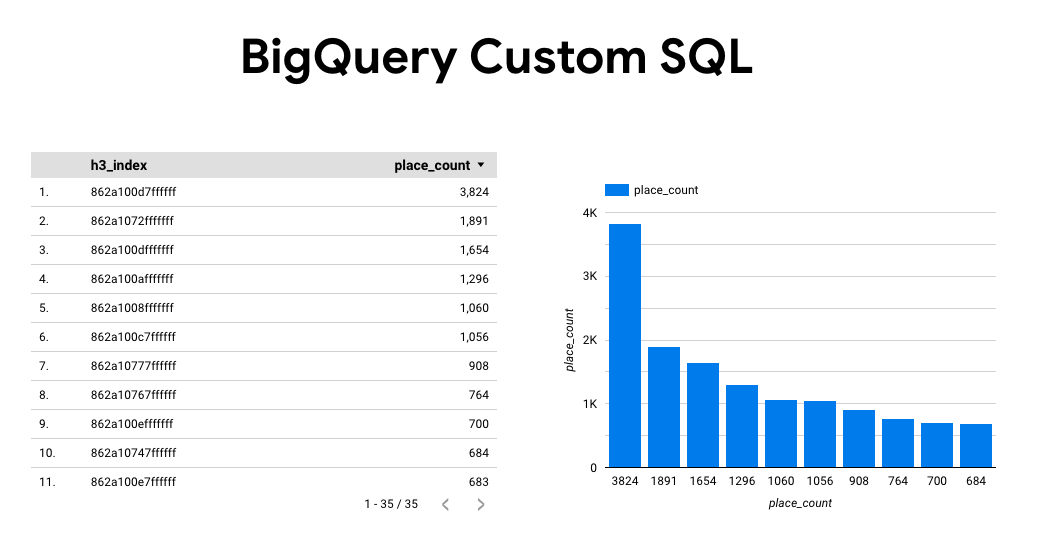
Looker Studio membuat halaman laporan default dan menginisialisasinya dengan judul, tabel, dan grafik batang dari hasil.
Pilih semua yang ada di halaman, lalu hapus.
Klik Sisipkan -> Peta wilayah untuk menambahkan peta wilayah ke laporan Anda.
Di bagian Jenis diagram -> Penyiapan, konfigurasikan kolom seperti yang ditunjukkan di bawah ini:
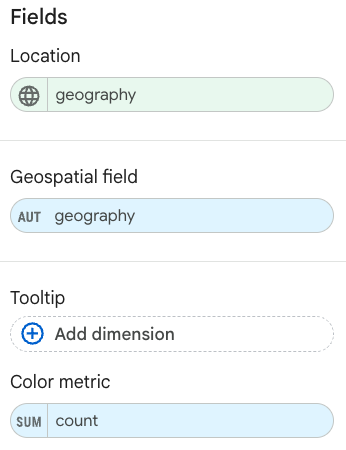
Peta yang diisi akan muncul seperti di atas. Anda dapat memilih Jenis diagram -> Gaya untuk mengonfigurasi lebih lanjut tampilan peta.
Untuk mengetahui informasi dan contoh selengkapnya tentang cara memvisualisasikan hasil Insight Tempat, lihat Memvisualisasikan hasil kueri.