Die Funktion PLACES_COUNT_PER_GEO verwendet ein Array von geografischen Einheiten für die Suche und gibt eine Tabelle mit der Anzahl der Orte pro Einheit zurück. Wenn Sie beispielsweise ein Array von Postleitzahlen als Suchbereich angeben, enthält die Antwort eine Tabelle mit einer separaten Zeile für jede Postleitzahl.
Da die Funktion PLACES_COUNT_PER_GEO eine Tabelle zurückgibt, rufen Sie sie mit einer FROM-Klausel auf.
Eingabeparameter:
Erforderlich: Der
geographies-Filterparameter, der den Suchbereich angibt. Der Parametergeographiesakzeptiert ein Array von Werten, die durch den BigQuery-DatentypGEOGRAPHYdefiniert werden. Dieser unterstützt Punkte, Linienzüge und Polygone.Optional: Zusätzliche Filterparameter, um die Suche einzugrenzen.
Liefert:
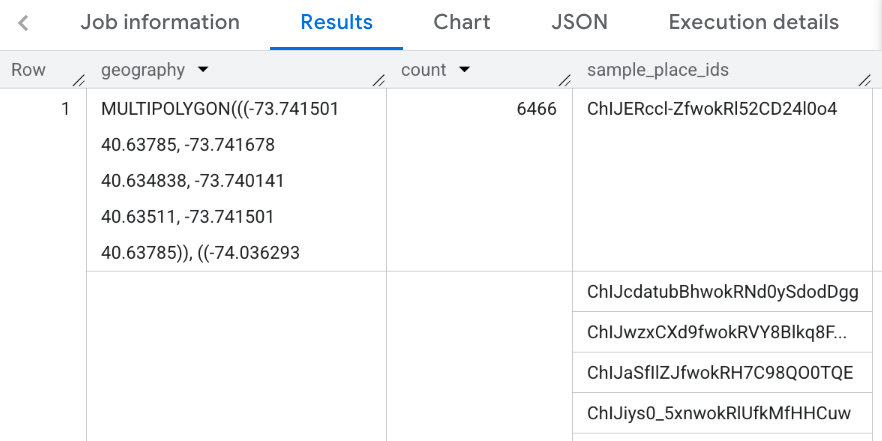
- Eine Tabelle mit einer Zeile pro geografischem Bereich. Die Tabelle enthält die Spalten
geography(GEOGRAPHY),count(INT64) undplace_ids(ARRAY<STRING>), wobeiplace_idsbis zu 250 Orts-IDs für jedes geografische Gebiet enthält.
- Eine Tabelle mit einer Zeile pro geografischem Bereich. Die Tabelle enthält die Spalten
Beispiel: Anzahl der Restaurants in jedem Bezirk von New York City berechnen
In diesem Beispiel wird eine Tabelle mit der Anzahl der betriebsbereiten Restaurants pro Bezirk in New York City generiert.
In diesem Beispiel wird das öffentliche BigQuery-Dataset Daten des US Census Bureau verwendet, um die Grenzen der drei Bezirke in New York City abzurufen: „Queens“, „Kings“ und „New York“. Die Grenzen der einzelnen Landkreise sind in der Spalte county_geom enthalten.
In diesem Beispiel wird dann die BigQuery-Funktion ST_SIMPLIFY verwendet, um eine vereinfachte Version von county_geom zurückzugeben. Mit der Funktion ST_SIMPLIFY werden nahezu gerade Verkettungen von Kanten durch eine einzelne lange Kante ersetzt.
DECLARE geos ARRAY<GEOGRAPHY>;

SET geos = (SELECT ARRAY_AGG(ST_SIMPLIFY(county_geom, 100))
            FROM `bigquery-public-data.geo_us_boundaries.counties`
            WHERE county_name IN ("Queens","Kings", "New York") AND state_fips_code = "36");

SELECT * FROM `PROJECT_NAME.places_insights___us.PLACES_COUNT_PER_GEO`(
  JSON_OBJECT(
      'geographies', geos,
      'types', ["restaurant"],
      'business_status', ["OPERATIONAL"]
      )
);
Die Antwort für die Funktion:
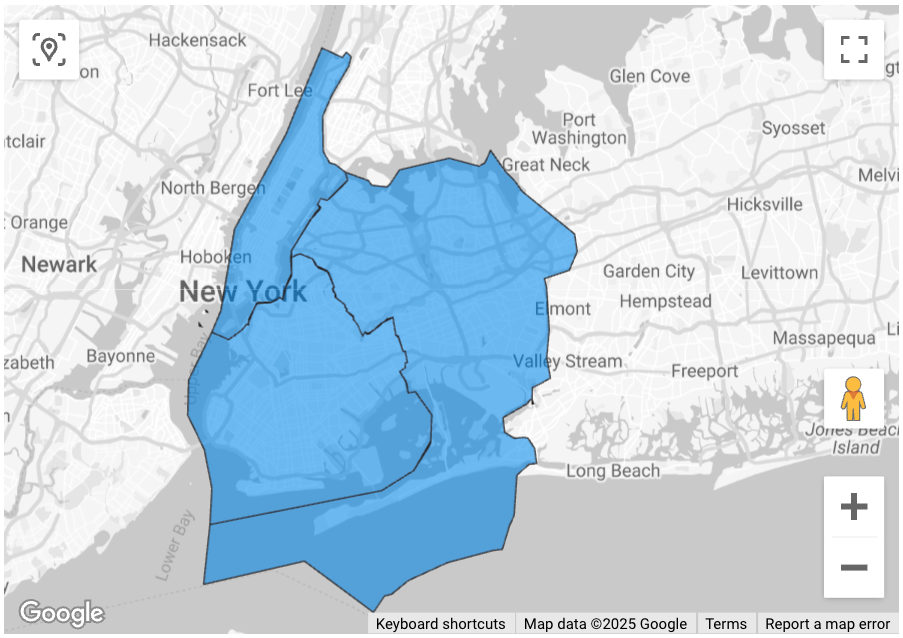
Ergebnisse visualisieren
Die folgenden Bilder zeigen diese Daten in Looker Studio als gefüllte Karte, einschließlich der Umrisse der einzelnen Landkreise:
So importieren Sie Ihre Daten in Looker Studio:
Führen Sie die Funktion oben aus, um die Ergebnisse zu generieren.
Klicken Sie in den BigQuery-Ergebnissen auf Öffnen in > Looker Studio. Ihre Ergebnisse werden automatisch in Looker Studio importiert.
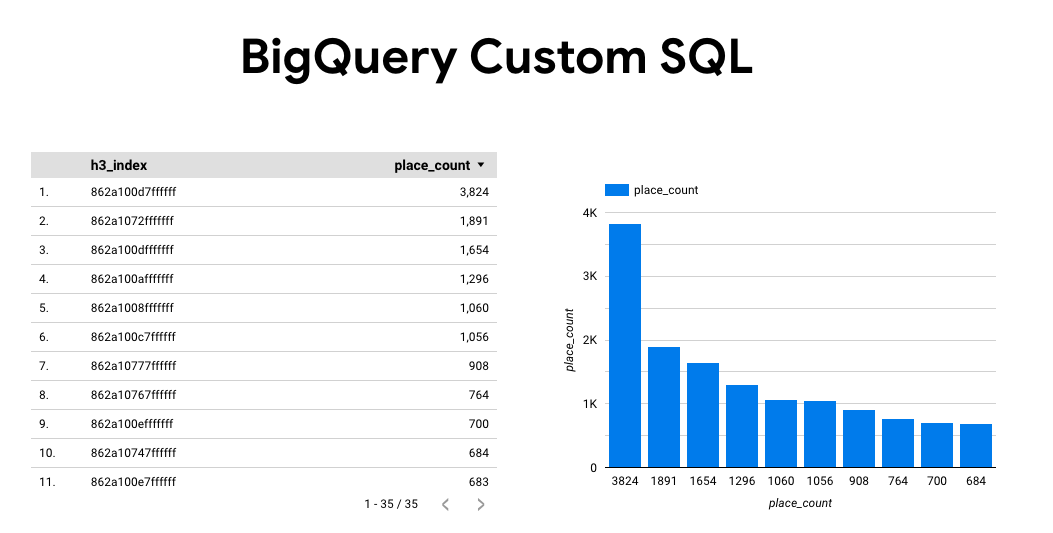
In Looker Studio wird eine Standardberichtsseite erstellt und mit einem Titel, einer Tabelle und einem Balkendiagramm der Ergebnisse initialisiert.
Wählen Sie alles auf der Seite aus und löschen Sie es.
Klicken Sie auf Einfügen > Karte mit Flächen, um Ihrem Bericht eine Karte mit Flächen hinzuzufügen.
Konfigurieren Sie die Felder unter Diagrammtypen > Einrichtung wie unten dargestellt:
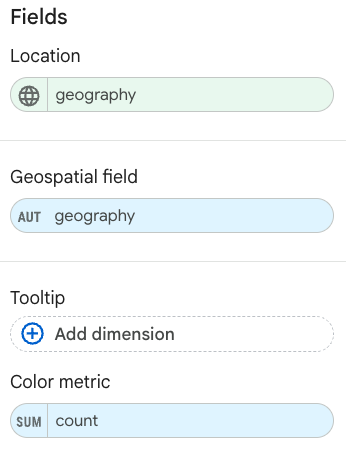
Die gefüllte Karte sieht dann so aus: Optional können Sie Diagrammtypen –> Stile auswählen, um die Darstellung der Karte weiter zu konfigurieren.
Weitere Informationen und ein Beispiel für die Visualisierung von Places Insights-Ergebnissen finden Sie unter Abfrageergebnisse visualisieren.