La funzione PLACES_COUNT_PER_GEO accetta una matrice di aree geografiche in cui eseguire la ricerca
e restituisce una tabella con il conteggio dei luoghi per area. Ad esempio, se specifichi un
array di codici postali come area di ricerca, la risposta contiene una tabella con una
riga separata per ogni codice postale.
Poiché la funzione PLACES_COUNT_PER_GEO restituisce una tabella, chiamala utilizzando
una clausola FROM.
Parametri di input:
Obbligatorio: il
geographiesparametro di filtro che specifica l'area di ricerca. Il parametrogeographiesaccetta un array di valori definiti dal tipo di datiGEOGRAPHYdi BigQuery, che supporta punti, linestring e poligoni.(Facoltativo) Parametri di filtro aggiuntivi per perfezionare la ricerca.
Restituisce:
- Una tabella con una riga per area geografica. La tabella contiene le colonne
geography(GEOGRAPHY),count(INT64) eplace_ids(ARRAY<STRING>), doveplace_idscontiene fino a 250 ID luogo per ogni area geografica.
- Una tabella con una riga per area geografica. La tabella contiene le colonne
Esempio: calcola il numero di ristoranti in ogni contea di New York City
Questo esempio genera una tabella dei conteggi dei ristoranti operativi per contea a New York City.
Questo esempio utilizza il set di dati pubblico BigQuery United States Census Bureau Data per ottenere i confini delle tre contee di New York City: "Queens","Kings" e "New York". I confini di ogni contea sono contenuti nella colonna county_geom.
Questo esempio utilizza quindi la funzione BigQuery
ST_SIMPLIFY
per restituire una versione semplificata di county_geom. La funzione ST_SIMPLIFY
sostituisce le catene di bordi quasi rettilinee con un unico bordo lungo.
DECLARE geos ARRAY<GEOGRAPHY>;

SET geos = (SELECT ARRAY_AGG(ST_SIMPLIFY(county_geom, 100))
            FROM `bigquery-public-data.geo_us_boundaries.counties`
            WHERE county_name IN ("Queens","Kings", "New York") AND state_fips_code = "36");

SELECT * FROM `PROJECT_NAME.places_insights___us.PLACES_COUNT_PER_GEO`(
  JSON_OBJECT(
      'geographies', geos,
      'types', ["restaurant"],
      'business_status', ["OPERATIONAL"]
      )
);
La risposta per la funzione:
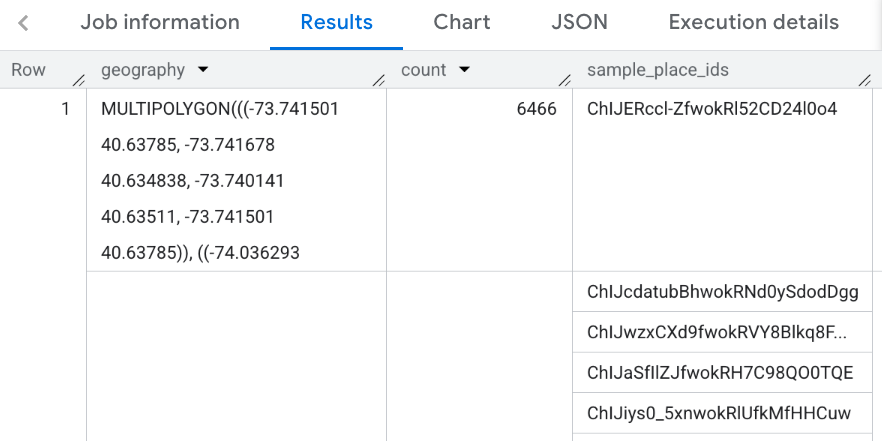
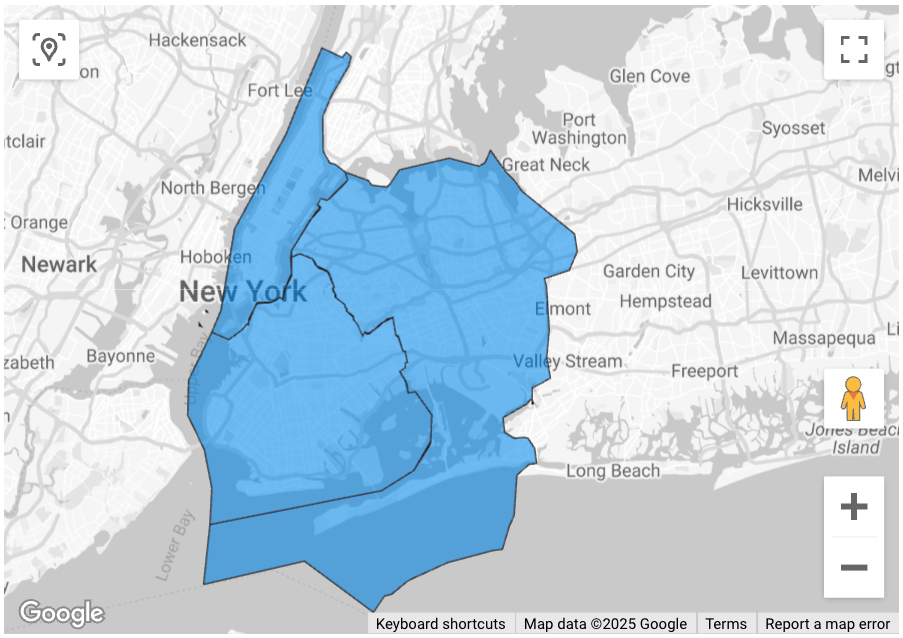
Visualizzare i risultati
Le seguenti immagini mostrano questi dati visualizzati in Looker Studio come una mappa riempita, inclusa la linea di contorno di ogni contea:
Per importare i dati in Looker Studio:
Esegui la funzione riportata sopra per generare i risultati.
Nei risultati di BigQuery, fai clic su Apri in > Looker Studio. I risultati vengono importati automaticamente in Looker Studio.
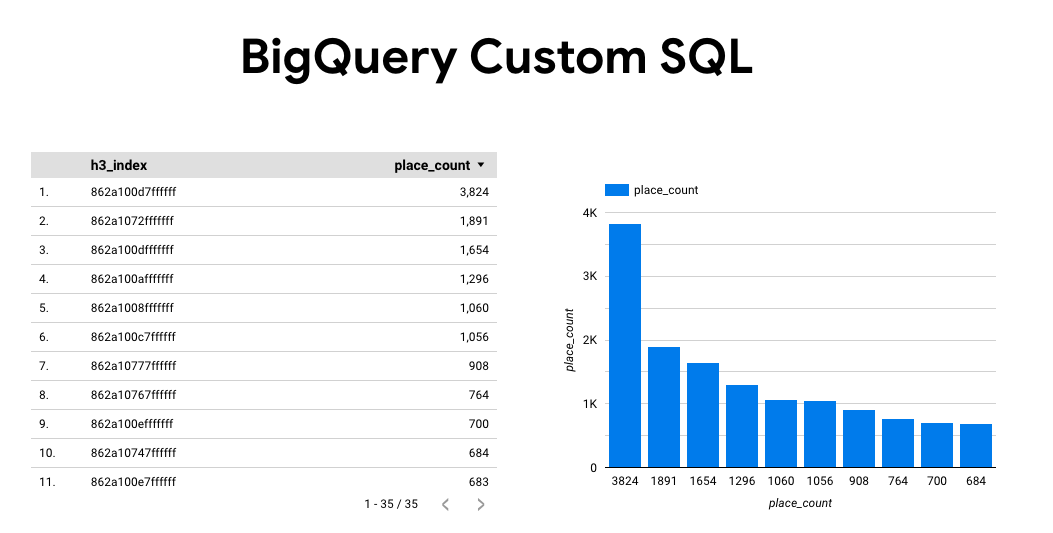
Looker Studio crea una pagina del report predefinita e la inizializza con un titolo, una tabella e un grafico a barre dei risultati.
Seleziona tutti i contenuti della pagina ed eliminali.
Fai clic su Inserisci > Mappa coropletica per aggiungere una mappa coropletica al report.
In Tipi di grafici -> Configurazione, configura i campi come mostrato di seguito:
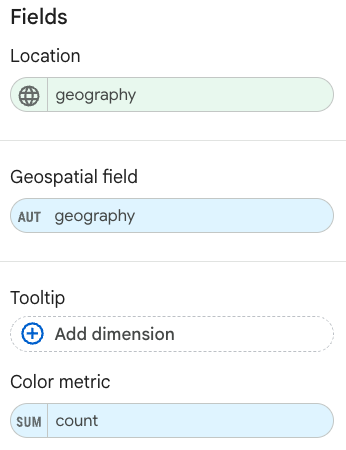
La mappa riempita viene visualizzata come sopra. Se vuoi, puoi selezionare Tipi di grafici -> Stili per configurare ulteriormente l'aspetto della mappa.
Per ulteriori informazioni ed esempi sulla visualizzazione dei risultati di Places Insights, vedi Visualizzare i risultati delle query.