Page Summary
-
Aqueduct Floods data provides measurements of riverine and coastal flood risks for current conditions and future projections up to 2080.
-
The dataset includes hazard maps, risk assessments, and tools for cost-benefit analysis of flood protection strategies.
-
This data is recommended for larger scale regional analysis, preliminary assessments, and evaluating relative changes in flood impacts under different climate scenarios.
-
The dataset is not suitable for detailed property-specific flood inundation mapping, analyzing flat lowland rivers with significant backwater effects, or assessing the impact of hydraulic structures.
- Dataset Availability
- 2010-01-01T00:00:00Z–2080-12-31T23:59:59Z
- Dataset Producer
- World Resources Institute
- Tags
Description
Aqueduct Floods data measures riverine and coastal food risks under both current baseline conditions and future projections in 2030, 2050, and 2080. In addition to providing hazard maps and assessing risks, Aqueduct Floods helps to conduct comprehensive cost-benefit analysis to evaluate the value of dike flood protection strategies.
Aqueduct Floods aims to empower disaster risk analysts and managers with quantitative information on food risks and adaptation strategy costs, and to help inform policy and investment decision-making.
Google Earth Engine team recommendation:
This dataset can be used for:
- Larger scale regional analysis: what is the broad risk to the big area of the size of a US county level / large city?
- Preliminary assessments: when you need a quick, regional-scale "first look" at potential changes in river discharge without needing precise floodplain inundation maps.
- Relative changes: This looks at different climate scenarios so can be used for generalized changes in magnitude of impacts
This dataset should not be used for:
- Detailed flood inundation mapping: such as looking at properties specific risk
- Flat, lowland rivers: the simplification of the equations do not take into account backwater effects (water flowing backwards) which happens a lot in flood plains
- Analyzing hydraulic structures: it is not suitable for assessing the specific impact of structures like bridges, levees, or weirs that cause significant backwater effects
Please see the technical note from data provider for full details on the methods used and to understand if this data is right for your application.
Bands
Pixel Size
1000 meters
Bands
| Name | Units | Min | Max | Pixel Size | Description |
|---|---|---|---|---|---|
inundation_depth |
m | 0* | 32.05* | meters | Flood inundation depth |
Image Properties
Image Properties
| Name | Type | Description |
|---|---|---|
| climatescenario | STRING | Climate Scenario types:
|
| floodtype | STRING | Type of Flood:
|
| projection | INT | Sea level rise scenario (in percentile)
|
| returnperiod | INT | Return period is the average time interval expected between hazard events of a given magnitude or greater (in years). The flood hazard maps are generated for return periods of 1, 2, 5, 10, 25, 50, 100, 250, 500, and 1000 years. |
| subsidence | STRING | Applies only for inuncoast flood type
|
| model | STRING | Applies only for inunriver flood type, represents type of model used.
|
| year | INT | Flood occurrence year |
Terms of Use
Terms of Use
The WRI datasets are available without restriction on use or distribution. WRI does request that the user give proper attribution and identify WRI, where applicable, as the source of the data. For more information check WRI's open data commitment,
Explore with Earth Engine
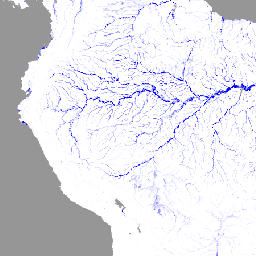
Code Editor (JavaScript)
var dataset = ee.ImageCollection('WRI/Aqueduct_Flood_Hazard_Maps/V2');
var inundationDepth = dataset.select('inundation_depth');
var inundationDepthVis = {
  min: 0,
  max: 1,
  palette: ['ffffff','0000ff'],
};
Map.setCenter(-68.36, -6.73, 4);
Map.addLayer(inundationDepth, inundationDepthVis, 'Aqueduct Flood Hazard Maps');