Page Summary
-
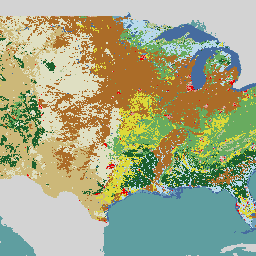
The National Land Cover Database (NLCD) 2021 release provides spatially explicit and reliable information on land cover and land cover change in the U.S.
-
This dataset, developed by the USGS in partnership with federal agencies, is part of a series of NLCD products released since 1992, with recent products at two-to-three-year intervals.
-
The NLCD 2021 release is update-based, utilizing unchanged land cover and impervious surface products from the 2019 release for change analysis, while updating science products and the change index.
-
The dataset includes bands for land cover, impervious surface percentage and descriptors, land cover change count, first disturbance date, and a land cover change index, all at a 30-meter pixel size.
-
Most USGS information, including this dataset, is in the public domain and can be used, transferred, or reproduced without copyright restriction.
- Dataset Availability
- 2021-01-01T00:00:00Z–2022-01-01T00:00:00Z
- Dataset Producer
- USGS
- Tags
Description
The U.S. Geological Survey (USGS), in partnership with several federal agencies, has now developed and released seven National Land Cover Database (NLCD) products: NLCD 1992, 2001, 2006, 2011, 2016, 2019, and 2021. Beginning with the 2016 release, land cover products were created for two-to-three-year intervals between 2001 and the most recent year. These products provide spatially explicit and reliable information on the Nation’s land cover and land cover change. NLCD continues to provide innovative, consistent, and robust methodologies for production of a multi-temporal land cover and land cover change database.
The NLCD 2021 release is update based, so the Land Cover and Impervious Surface products released in 2019 are unchanged and used directly with NLCD 2021 for change analysis though the NLCD timespan. Science products and the change index are updated and will need to be reacquired to contain the additional 2021 change. These new products use a streamlined compositing process for assembling and preprocessing Landsat imagery and geospatial ancillary datasets; a temporally, spectrally, and spatially integrated land cover change analysis strategy; a theme-based post-classification protocol for generating land cover and change products; a continuous fields biophysical parameters modeling method; and a scripted operational system. The overall accuracy of the 2019 Level I land cover was 91%. Results from this study confirm the robustness of this comprehensive and highly automated procedure for NLCD 2021 operational mapping (see doi:10.1080/15481603 for the latest accuracy assessment publication). Questions about the NLCD 2021 land cover product can be directed to the NLCD 2021 land cover mapping team at USGS EROS, Sioux Falls, SD (605) 594-6151 or mrlc@usgs.gov. See included spatial metadata for more details.
Please see National Land Cover Database (NLCD) 2019 NLCD release for the 2019 release of NLCD which is used with the 2021 release for comparisons through the years. Also refer to the larger NLCD Community page for all things NLCD related National Land Cover Database (NLCD) NLCD Community Page.
Bands
Bands
Pixel size: 30 meters (all bands)
| Name | Units | Min | Max | Pixel Size | Description |
|---|---|---|---|---|---|
landcover |
11 | 95 | 30 meters | All images include the landcover classification scheme described in the Product Legend. The legends are also available as metadata on each image. The classes in the product legend are given below. |
|
impervious |
% | 0 | 100 | 30 meters | Percent of the pixel covered by developed impervious surface. |
impervious_descriptor |
20 | 29 | 30 meters | Defines which impervious layer pixels are roads and provides the best fit description for impervious pixels that are not roads. |
|
science_products_land_cover_change_count |
1 | 8 | 30 meters | These products were developed as both intermediate steps to generate the base NLCD products, and as value added products that standalone to provide additional insights. This product was derived using the 9-epoch NLCD land cover (2001, 2003, 2006, 2008, 2011, 2013, 2016, 2019, and 2021) from the released NLCD 2021 product suite. Any change between two consecutive epochs is calculated and the total change frequency/time for each pixel is recorded. This product shows an integer count total of any recorded change for the time period 2001-2021. This product is meant to be used with the change index and individual dates of Land Cover to provide users with a more in depth look at where multiple change events in the same location are occurring on the landscape. All images include the Science Products classification scheme follow the Land Cover system and are described in the Product Legend. The legends are also available as metadata on each image. The classes in the product legend are given below. |
|
science_products_land_cover_change_first_disturbance_date |
1 | 9 | 30 meters | These products were developed as both intermediate steps to generate the base NLCD products, and as value added products that standalone to provide additional insights. This product was derived using the nine release dates of NLCD land cover (2001, 2003, 2006, 2008, 2011, 2013, 2016, 2019, 2021). This product shows the date of the first land cover change event from these 9 dates of landcover. All images include the Science Products classification scheme follow the Land Cover system and are described in the Product Legend. The legends are also available as metadata on each image. The classes in the product legend are given below. |
|
science_products_land_cover_change_index |
1 | 13 | 30 meters | These products were developed as both intermediate steps to generate the base NLCD products, and as value added products that standalone to provide additional insights. The NLCD Land Cover change index combines information from all years of land cover change and provides a simple and comprehensive way to visualize change from all 9 dates of land cover in a single layer. The change index was designed to assist NLCD users to understand complex land cover change with a single product. NLCD 2021 does not yet contain updated products for Alaska, Hawaii and Puerto Rico. All images include the Science Products classification scheme follow the Land Cover system and are described in the Product Legend. The legends are also available as metadata on each image. The classes in the product legend are given below. |
|
science_products_land_cover_science_product |
11 | 95 | 30 meters | These products were developed as both intermediate steps to generate the base NLCD products, and as value added products that standalone to provide additional insights. To better develop NLCD 2021 landcover, spectrally stable grass and shrub areas were separated from the spectrally changing areas of shrub and grass represented by forest harvest, burns, regrowth, and other disturbances. Essentially, this separation usually identifies shrub and grass climax areas from shrub and grass areas in transition back to a forest. This difference is expressed with two extra classes of land cover, called Shrub-Forest and Herbaceous-Forest which are representing areas of current shrub and grass expected to transition back to a forest. Alternatively, the shrub and grass classes of Shrub/Scrub and Grassland/Herbaceous will likely not transition to a forest. However, be cautioned that no extensive ecological analysis went into these class delineations, they are primarily spectral based separations used to delineate broad classes of grass and shrub. All images include the Science Products classification scheme follow the Land Cover system and are described in the Product Legend. The legends are also available as metadata on each image. The classes in the product legend are given below. |
|
science_products_forest_disturbance_date |
83 | 200 | 30 meters | These products were developed as both intermediate steps to generate the base NLCD products, and as value added products that standalone to provide additional insights. This product shows the most recent forest disturbance date between the years 1986-2021 for every year. This product combines information from the NLCD 2021 change detection, land cover classification, and the LANDFIRE Vegetation Change Tracker (VCT) disturbance product from 1984-2010. For NLCD 2021, this product was used to assess where disturbance occurred for forest areas. This product was originally intended only for forest areas, but it also can be useful for other landcover classes. For example, agricultural areas, which are typically disturbed yearly by tillage, are represented as being disturbed prior to 1986. This "prior to 86" disturbance call was used in some instances as a delineation between forested and non-forest areas. Other classes that are not forest may also be represented with a disturbance indication if the area was forest at some time point during 1986-2021. All images include the Science Products classification scheme follow the Land Cover system and are described in the Product Legend. The legends are also available as metadata on each image. The classes in the product legend are given below. |
landcover Class Table
| Value | Color | Description |
|---|---|---|
| 11 | #466b9f | Open water: areas of open water, generally with less than 25% cover of vegetation or soil. |
| 12 | #d1def8 | Perennial ice/snow: areas characterized by a perennial cover of ice and/or snow, generally greater than 25% of total cover. |
| 21 | #dec5c5 | Developed, open space: areas with a mixture of some constructed materials, but mostly vegetation in the form of lawn grasses. Impervious surfaces account for less than 20% of total cover. These areas most commonly include large-lot single-family housing units, parks, golf courses, and vegetation planted in developed settings for recreation, erosion control, or aesthetic purposes. |
| 22 | #d99282 | Developed, low intensity: areas with a mixture of constructed materials and vegetation. Impervious surfaces account for 20% to 49% percent of total cover. These areas most commonly include single-family housing units. |
| 23 | #eb0000 | Developed, medium intensity: areas with a mixture of constructed materials and vegetation. Impervious surfaces account for 50% to 79% of the total cover. These areas most commonly include single-family housing units. |
| 24 | #ab0000 | Developed high intensity: highly developed areas where people reside or work in high numbers. Examples include apartment complexes, row houses, and commercial/industrial. Impervious surfaces account for 80% to 100% of the total cover. |
| 31 | #b3ac9f | Barren land (rock/sand/clay): areas of bedrock, desert pavement, scarps, talus, slides, volcanic material, glacial debris, sand dunes, strip mines, gravel pits, and other accumulations of earthen material. Generally, vegetation accounts for less than 15% of total cover. |
| 41 | #68ab5f | Deciduous forest: areas dominated by trees generally greater than 5 meters tall, and greater than 20% of total vegetation cover. More than 75% of the tree species shed foliage simultaneously in response to seasonal change. |
| 42 | #1c5f2c | Evergreen forest: areas dominated by trees generally greater than 5 meters tall, and greater than 20% of total vegetation cover. More than 75% of the tree species maintain their leaves all year. Canopy is never without green foliage. |
| 43 | #b5c58f | Mixed forest: areas dominated by trees generally greater than 5 meters tall, and greater than 20% of total vegetation cover. Neither deciduous nor evergreen species are greater than 75% of total tree cover. |
| 52 | #ccb879 | |
| 71 | #dfdfc2 | |
| 81 | #dcd939 | |
| 82 | #ab6c28 | Cultivated crops: areas used for the production of annual crops, such as corn, soybeans, vegetables, tobacco, and cotton, and also perennial woody crops such as orchards and vineyards. Crop vegetation accounts for greater than 20% of total vegetation. This class also includes all land being actively tilled. |
| 90 | #b8d9eb | Woody wetlands: areas where forest or shrubland vegetation accounts for greater than 20% of vegetative cover and the soil or substrate is periodically saturated with or covered with water. |
| 95 | #6c9fb8 | Emergent herbaceous wetlands: areas where perennial herbaceous vegetation accounts for greater than 80% of vegetative cover and the soil or substrate is periodically saturated with or covered with water. |
impervious_descriptor Class Table
| Value | Color | Description |
|---|---|---|
| 0 | #000000 | Unclassified. |
| 20 | #ff0000 | Primary road. Interstates and other major roads. Pixels were derived from the 2018 NavStreets Street Data. |
| 21 | #ffff00 | Secondary road. Non-interstate highways. Pixels were derived from the 2018 NavStreets Street Data. |
| 22 | #0000ff | Tertiary road. Any two-lane road. Pixels were derived from the 2018 NavStreets Street Data. |
| 23 | #ffffff | Thinned road. Small tertiary roads that generally are not paved and have been removed from the landcover but remain as part of the impervious surface product. Pixels were derived from the 2018 NavStreets Street Data. |
| 24 | #ffc0c5 | Non-road non-energy impervious. Developed areas that are generally not roads or energy production; includes residential/commercial/industrial areas, parks, and golf courses. |
| 25 | #eb82eb | Microsoft buildings. Buildings not captured in the NLCD impervious process, and not included in the nonroad impervious surface class. Pixels derived from the Microsoft US Building Footprints dataset. |
| 26 | #9f1feb | LCMAP impervious. Impervious pixels from LCMAP that were used to fill in gaps left when roads were updated from previous versions of NLCD. |
| 27 | #40dfd0 | Wind turbines. Pixels derived from the US Wind Turbine Dataset, accessed on 1/9/2020. |
| 28 | #79ff00 | Well pads. Pixels derived from the 2019 Oil and Natural Gas Wells dataset from the Oak Ridge National Laboratory. |
| 29 | #005f00 | Other energy production. Areas previously identified as well pads and wind turbines and classified in coordination with the Landfire project. |
science_products_land_cover_change_count Class Table
| Value | Color | Description |
|---|---|---|
| 1 | #0000ff | change once 2001-2019 |
| 2 | #00d0ff | change twice 2001-2019 |
| 3 | #00fffa | change three times 2001-2019 |
| 4 | #00ff7d | change four times 2001-2019 |
| 5 | #79ff00 | change five times 2001-2019 |
| 6 | #ffff00 | change six times 2001-2019 |
| 7 | #ffd000 | change seven times 2001-2019 |
| 8 | #ff0000 | change eight times 2001-2021 |
science_products_land_cover_change_first_disturbance_date Class Table
| Value | Color | Description |
|---|---|---|
| 1 | #005f00 | land cover no change |
| 2 | #0000ff | land cover change 2001-2004 |
| 3 | #00d0ff | land cover change 2004-2006 |
| 4 | #00fffa | land cover change 2006-2008 |
| 5 | #00ff7d | land cover change 2008-2011 |
| 6 | #79ff00 | land cover change 2011-2013 |
| 7 | #ffff00 | land cover change 2013-2016 |
| 8 | #ffd000 | land cover change 2016-2019 |
| 9 | #ff0000 | land cover change 2019-2021 |
science_products_land_cover_change_index Class Table
| Value | Color | Description |
|---|---|---|
| 1 | #005f00 | no change |
| 2 | #0000ff | water change |
| 3 | #eb82eb | urban change |
| 4 | #79ffd2 | wetland within class change |
| 5 | #009ede | herbaceous wetland change |
| 6 | #ffd000 | agriculture within class change |
| 7 | #9f2828 | cultivated crop change |
| 8 | #ffff00 | hay/pasture change |
| 9 | #dfdfc2 | rangeland herbaceous and shrub change |
| 10 | #b3ac9f | barren change |
| 11 | #79ff00 | forest change |
| 12 | #ff0000 | woody wetland change |
| 13 | #ffffff | snow change |
science_products_land_cover_science_product Class Table
| Value | Color | Description |
|---|---|---|
| 11 | #466b9f | Open Water |
| 12 | #d1def8 | Perennial Snow/Ice |
| 21 | #dec5c5 | Developed, Open Space |
| 22 | #d99282 | Developed, Low Intensity |
| 23 | #eb0000 | Developed, Medium Intensity |
| 24 | #ab0000 | Developed, High Intensity |
| 31 | #b3ac9f | Barren Land |
| 41 | #68ab5f | Deciduous Forest |
| 42 | #1c5f2c | Evergreen Forest |
| 43 | #b5c58f | Mixed Forest |
| 45 | #79ffd2 | Shrub-Forest |
| 46 | #9f1feb | Herbaceous-Forest |
| 52 | #ccb879 | Shrub/Scrub |
| 71 | #dfdfc2 | Herbaceous |
| 81 | #dcd939 | Hay/Pasture |
| 82 | #ab6c28 | Cultivated Crops |
| 90 | #b8d9eb | Woody Wetlands |
| 95 | #6c9fb8 | Emergent Herbaceous Wetlands |
science_products_forest_disturbance_date Class Table
| Value | Color | Description |
|---|---|---|
| 83 | #0000ff | non-forest or forest before 1983 |
| 84 | #0033ff | forest disturbed before/at 1984 |
| 85 | #005fff | forest disturbed before/at 1985 |
| 86 | #0087ff | forest disturbed before/at 1986 |
| 87 | #00aaff | forest disturbed before/at 1987 |
| 88 | #00c5ff | forest disturbed before/at 1988 |
| 89 | #00dcff | forest disturbed before/at 1989 |
| 90 | #00ecff | forest disturbed before/at 1990 |
| 91 | #00f8ff | forest disturbed before/at 1991 |
| 92 | #00fdff | forest disturbed before/at 1992 |
| 93 | #00fffd | forest disturbed before/at 1993 |
| 94 | #00fff8 | forest disturbed before/at 1994 |
| 95 | #00ffec | forest disturbed before/at 1995 |
| 96 | #00ffdc | forest disturbed before/at 1996 |
| 97 | #00ffc5 | forest disturbed before/at 1997 |
| 98 | #00ffaa | forest disturbed before/at 1998 |
| 99 | #00ff87 | forest disturbed before/at 1999 |
| 100 | #00ff5f | forest disturbed before/at 2000 |
| 101 | #00ff33 | forest disturbed before/at 2001 |
| 102 | #00ff00 | forest disturbed before/at 2002 |
| 103 | #33ff00 | forest disturbed before/at 2003 |
| 104 | #5fff00 | forest disturbed before/at 2004 |
| 105 | #87ff00 | forest disturbed before/at 2005 |
| 106 | #aaff00 | forest disturbed before/at 2006 |
| 107 | #c5ff00 | forest disturbed before/at 2007 |
| 108 | #dcff00 | forest disturbed before/at 2008 |
| 109 | #ecff00 | forest disturbed before/at 2009 |
| 110 | #f8ff00 | forest disturbed before/at 2010 |
| 111 | #fdff00 | forest disturbed before/at 2011 |
| 112 | #fffd00 | forest disturbed before/at 2012 |
| 113 | #fff800 | forest disturbed before/at 2013 |
| 114 | #ffec00 | forest disturbed before/at 2014 |
| 115 | #ffdc00 | forest disturbed before/at 2015 |
| 116 | #ffc500 | forest disturbed before/at 2016 |
| 117 | #ffaa00 | forest disturbed before/at 2017 |
| 118 | #ff8700 | forest disturbed before/at 2018 |
| 119 | #ff5f00 | forest disturbed before/at 2019 |
| 120 | #ff3300 | forest disturbed before/at 2020 |
| 121 | #ff0000 | forest disturbed before/at 2021 |
| 200 | #ffffff | forest no change |
Image Properties
Image Properties
| Name | Type | Description |
|---|---|---|
| landcover_class_names | DOUBLE | Landcover class names |
| landcover_class_palette | DOUBLE | Landcover class palette |
| landcover_class_values | DOUBLE | Landcover class values |
| impervious_descriptor_class_names | DOUBLE | Impervious descriptor class names |
| impervious_descriptor_class_palette | DOUBLE | Impervious descriptor class palette |
| impervious_descriptor_class_values | DOUBLE | Impervious descriptor class values |
Terms of Use
Terms of Use
Most U.S. Geological Survey (USGS) information is federally created data and therefore reside in the public domain and may be used, transferred, or reproduced without copyright restriction. Additional information on Acknowledging or Crediting USGS as Information Source is available.
This work was authored as part of the Contributor's official duties as an Employee of the United States Government and is therefore a work of the United States Government. In accordance with 17 U.S.C. 105, no copyright protection is available for such works under U.S. Law. This is an Open Access article that has been identified as being free of known restrictions under copyright law, including all related and neighboring rights (https://creativecommons.org/publicdomain/mark/1.0/). You can copy, modify, distribute and perform the work, even for commercial purposes, all without asking permission.
Citations
Dewitz, J., 2023, National Land Cover Database (NLCD) 2021 Products: U.S. Geological Survey data release, doi:10.5066/P9JZ7AO3
DOIs
Explore with Earth Engine
Code Editor (JavaScript)
// Import the NLCD collection.
var dataset = ee.ImageCollection('USGS/NLCD_RELEASES/2021_REL/NLCD');

// The collection contains images for the 2021 year release and the full suite
// of products.
print('Products:', dataset.aggregate_array('system:index'));

// Filter the collection to the 2021 product.
var nlcd2021 = dataset.filter(ee.Filter.eq('system:index', '2021')).first();

// Each product has multiple bands for describing aspects of land cover.
print('Bands:', nlcd2021.bandNames());

// Select the land cover band.
var landcover = nlcd2021.select('landcover');

// Display land cover on the map.
Map.setCenter(-95, 38, 5);
Map.addLayer(landcover, null, 'Landcover');