Page Summary
-
The TIGER 2010 Blocks dataset from the United States Census Bureau contains approximately 11 million polygon features representing 2010 census blocks for the United States, the District of Columbia, Puerto Rico, and the Island areas.
-
The dataset includes attributes such as block number, block identifier, county and state FIPS codes, number of housing units, and population total from the 2010 census.
-
The data is available for the date range of 2010-01-01 to 2010-01-02.
-
Users should cite the US Census Bureau for any reports, publications, or derived products created using this dataset.
-
The dataset can be explored and visualized using Google Earth Engine.
- Dataset Availability
- 2010-01-01T00:00:00Z–2010-01-02T00:00:00Z
- Dataset Producer
- United States Census Bureau
- Tags
Description
The United States Census Bureau regularly releases a geodatabase named TIGER. This dataset contains the 2010 census blocks, roughly equivalent to a city block. There are just over 11 million polygon features covering the United States, the District of Columbia, Puerto Rico, and the Island areas.
For full technical details on all TIGER 2010 products, see the TIGER technical documentation.
Table Schema
Table Schema
| Name | Type | Description |
|---|---|---|
| blockce | STRING | 2010 Census tabulation block number |
| blockid10 | STRING | Block identifier: a concatenation of 2010 Census state Federal Information Processing Standards (FIPS) code, county FIPS code, census tract code, and tabulation block number |
| countyfp10 | STRING | County FIPS code |
| housing10 | DOUBLE | 2010 Census number of housing units |
| partflg | STRING | Partial block flag |
| pop10 | DOUBLE | Population total as of 2010 census |
| statefp10 | STRING | 2010 Census state FIPS code |
| tractce10 | STRING | 2010 Census tract code |
Terms of Use
Terms of Use
The U.S. Census Bureau offers some of its public data in machine-readable format via an Application Programming Interface (API). All of the content, documentation, code and related materials made available to you through the API are subject to these terms and conditions.
Citations
For the creation of any reports, publications, new data sets, derived products, or services resulting from the data set, users should cite the US Census Bureau.
Explore with Earth Engine
Code Editor (JavaScript)
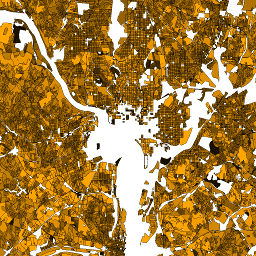
var dataset = ee.FeatureCollection('TIGER/2010/Blocks');
var visParams = {
  min: 0,
  max: 700,
  palette: ['black', 'brown', 'yellow', 'orange', 'red']
};

// Turn the strings into numbers
dataset = dataset.map(function (f) {
  return f.set('pop10', ee.Number.parse(f.get('pop10')));
});

var image = ee.Image().float().paint(dataset, 'pop10');

Map.setCenter(-73.99172, 40.74101, 13);
Map.addLayer(image, visParams, 'TIGER/2010/Blocks');
Map.addLayer(dataset, null, 'for Inspector', false);
Visualize as a FeatureView
A FeatureView is a view-only, accelerated representation of a
FeatureCollection. For more details, visit the
FeatureView documentation.
Code Editor (JavaScript)
var fvLayer = ui.Map.FeatureViewLayer('TIGER/2010/Blocks_FeatureView');

var visParams = {
  opacity: 1,
  color: {
    property: 'pop10',
    mode: 'linear',
    palette: ['black', 'brown', 'yellow', 'orange', 'red'],
    min: 0,
    max: 700
  }
};

fvLayer.setVisParams(visParams);
fvLayer.setName('US census blocks');

Map.setCenter(-73.99172, 40.74101, 13);
Map.add(fvLayer);