Page Summary
-
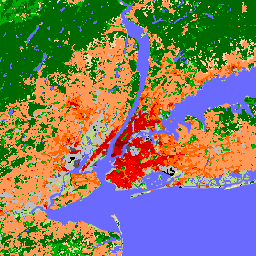
This dataset provides a global map of Local Climate Zones (LCZs) at 100m resolution for the year 2018, characterizing urban and rural landscapes based on land-cover and physical properties.
-
Local Climate Zones (LCZs) offer a classification scheme with 17 classes, including 10 urban built environment types and 7 natural land-cover types.
-
The dataset includes three bands:
LCZ,LCZ_Filter(recommended for most users, processed with a Gaussian filter), andLCZ_Probability(indicating the confidence of the LCZ classification). -
Users interested in more detailed natural land-cover classifications are advised to combine the built LCZ classes from this dataset with other land-cover products.
- Dataset Availability
- 2018-01-01T00:00:00Z–2019-01-01T00:00:00Z
- Dataset Producer
- Bochum Urban Climate Lab
- Tags
Description
Since their introduction in 2012, Local Climate Zones (LCZs) emerged as a new standard for characterizing urban landscapes, providing a holistic classification approach that takes into account micro-scale land-cover and associated physical properties.
This global map of Local Climate Zones, at 100m pixel size and representative for the nominal year 2018, is derived from multiple earth observation datasets and expert LCZ class labels. LCZ_Filter is the recommended band for most users. The other classification band, LCZ, is only provided as it is used to calculate the LCZ_Probability band.
The LCZ scheme complements other land use / land cover schemes by its focus on urban and rural landscape types, which can be described by any of the 17 classes in the LCZ scheme. Out of the 17 LCZ classes, 10 reflect the 'built' environment, and each LCZ type is associated with generic numerical descriptions of key urban canopy parameters critical to model atmospheric responses to urbanisation. In addition, since LCZs were originally designed as a new framework for urban heat island studies, they also contain a limited set (7) of 'natural' land-cover classes that can be used as 'control' or 'natural reference' areas.
As these seven natural classes in the LCZ scheme can not capture the heterogeneity of the world's existing natural ecosystems, we advise users - if required - to combine the built LCZ classes with any other land-cover product that provides a wider range of natural land-cover classes.
See also:
Bands
Bands
Pixel size: 100 meters (all bands)
| Name | Units | Pixel Size | Description |
|---|---|---|---|
LCZ |
100 meters | The raw, pixel-based global LCZ map with LCZ classes |
|
LCZ_Filter |
100 meters | The recommended global LCZ map with LCZ classes. LCZ labels are obtained after applying the morphological Gaussian filter described in Demuzere et al. (2020) |
|
LCZ_Probability |
% | 100 meters | A probability layer that identifies how often the modal LCZ was chosen per pixel (e.g. a probability of 60% means that the modal LCZ class was mapped 30 times out of 50 LCZ models). This is a pixel-based probability derived from the LCZ layer |
LCZ Class Table
| Value | Color | Description |
|---|---|---|
| 1 | #8c0000 | Compact highrise |
| 2 | #d10000 | Compact midrise |
| 3 | #ff0000 | Compact lowrise |
| 4 | #bf4d00 | Open highrise |
| 5 | #ff6600 | Open midrise |
| 6 | #ff9955 | Open lowrise |
| 7 | #faee05 | Lightweight lowrise |
| 8 | #bcbcbc | Large lowrise |
| 9 | #ffccaa | Sparsely built |
| 10 | #555555 | Heavy industry |
| 11 | #006a00 | Dense Trees (LCZ A) |
| 12 | #00aa00 | Scattered Trees (LCZ B) |
| 13 | #648525 | Bush, scrub (LCZ C) |
| 14 | #b9db79 | Low plants (LCZ D) |
| 15 | #000000 | Bare rock or paved (LCZ E) |
| 16 | #fbf7ae | Bare soil or sand (LCZ F) |
| 17 | #6a6aff | Water (LCZ G) |
LCZ_Filter Class Table
| Value | Color | Description |
|---|---|---|
| 1 | #8c0000 | Compact highrise |
| 2 | #d10000 | Compact midrise |
| 3 | #ff0000 | Compact lowrise |
| 4 | #bf4d00 | Open highrise |
| 5 | #ff6600 | Open midrise |
| 6 | #ff9955 | Open lowrise |
| 7 | #faee05 | Lightweight lowrise |
| 8 | #bcbcbc | Large lowrise |
| 9 | #ffccaa | Sparsely built |
| 10 | #555555 | Heavy industry |
| 11 | #006a00 | Dense Trees (LCZ A) |
| 12 | #00aa00 | Scattered Trees (LCZ B) |
| 13 | #648525 | Bush, scrub (LCZ C) |
| 14 | #b9db79 | Low plants (LCZ D) |
| 15 | #000000 | Bare rock or paved (LCZ E) |
| 16 | #fbf7ae | Bare soil or sand (LCZ F) |
| 17 | #6a6aff | Water (LCZ G) |
Terms of Use
Terms of Use
Citations
Demuzere M.; Kittner J.; Martilli A.; Mills, G.; Moede, C.; Stewart, I.D.; van Vliet, J.; Bechtel, B. A global map of local climate zones to support earth system modelling and urban-scale environmental science. Earth System Science Data 2022, 14 Volume 8: 3835-3873. doi:10.5194/essd-14-3835-2022
DOIs
Explore with Earth Engine
Code Editor (JavaScript)
var dataset = ee.ImageCollection('RUB/RUBCLIM/LCZ/global_lcz_map/latest')
            .mosaic();

var visualization = {
  bands: ['LCZ_Filter'],
  min: 1,
  max: 17,
  palette: [
    '8c0000','d10000','ff0000','bf4d00','ff6600',
    'ff9955','faee05','bcbcbc','ffccaa','555555',
    '006a00','00aa00','648525','b9db79','000000',
    'fbf7ae','6a6aff'
    ]
};

Map.setCenter(7.26, 51.44, 6);
Map.addLayer(dataset, visualization, 'LCZ_Filter');