Page Summary
-
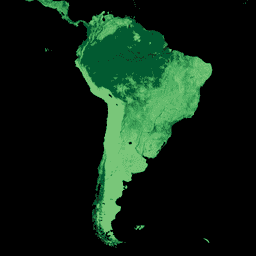
This dataset provides global maps of aboveground and belowground biomass carbon density for the year 2010 at a 300-m spatial resolution.
-
The maps integrate remotely sensed data and empirical models for different land cover types, including woody, grassland, cropland, and tundra biomass.
-
Uncertainty estimates for pixel-level biomass carbon density are also included in the dataset.
-
This dataset is publicly available and can be explored using the Google Earth Engine platform.

- Dataset Availability
- 2010-01-01T00:00:00Z–2010-12-31T00:00:00Z
- Dataset Producer
- NASA ORNL DAAC at Oak Ridge National Laboratory
- Cadence
- 1 Year
- Tags
Description
This dataset provides temporally consistent and harmonized global maps of aboveground and belowground biomass carbon density for the year 2010 at a 300-m spatial resolution. The aboveground biomass map integrates land-cover specific, remotely sensed maps of woody, grassland, cropland, and tundra biomass. Input maps were amassed from the published literature and, where necessary, updated to cover the focal extent or time period. The belowground biomass map similarly integrates matching maps derived from each aboveground biomass map and land-cover specific empirical models. Aboveground and belowground maps were then integrated separately using ancillary maps of percent tree cover and landcover and a rule-based decision tree. Maps reporting the accumulated uncertainty of pixel-level estimates are also provided.
Provider's note: The UN Environment Programme World Conservation Monitoring Centre (UNEP-WCMC) carbon biomass dataset represents conditions between 1982 and 2010 depending on land cover type. The relative patterns of carbon stocks are well represented with this dataset. The NASA/ORNL carbon biomass dataset represents biomass conditions for 2010, with uncertainty estimates at the pixel-level. Additional biomass of non-dominant land cover types are represented within each pixel. For more detailed information, please refer to the papers describing each dataset: WCMC (Soto-Navarro et al. 2020) and NASA/ORNL (Spawn et al. 2020).
Bands
Pixel Size
300 meters
Bands
| Name | Units | Min | Max | Pixel Size | Description |
|---|---|---|---|---|---|
agb |
Mg/ha | 0* | 129* | meters | Aboveground living biomass carbon stock density of combined woody and herbaceous cover in 2010. This includes carbon stored in living plant tissues that are located above the earth's surface (stems, bark, branches, twigs). This does not include leaf litter or coarse woody debris that were once attached to living plants but have since been deposited and are no longer living. |
agb_uncertainty |
Mg/ha | 0* | 85* | meters | Uncertainty of estimated aboveground living biomass carbon density of combined woody and herbaceous cover in 2010. Uncertainty represents the cumulative standard error that has been propagated through the harmonization process using summation in quadrature. |
bgb |
Mg/ha | 0* | 57* | meters | Belowground living biomass carbon stock density of combined woody and herbaceous cover in 2010. This includes carbon stored in living plant tissues that are located below the earth's surface (roots). This does not include dead and/or dislocated root tissue, nor does it include soil organic matter. |
bgb_uncertainty |
Mg/ha | 0* | 37* | meters | Uncertainty of estimated belowground living biomass carbon density of combined woody and herbaceous cover in 2010. Uncertainty represents the cumulative standard error that has been propagated through the harmonization process using summation in quadrature. |
Terms of Use
Terms of Use
This dataset is in the public domain and is available without restriction on use and distribution. See NASA's Earth Science Data & Information Policy for additional information.
Citations
Spawn, S.A., Sullivan, C.C., Lark, T.J. et al. Harmonized global maps of above and belowground biomass carbon density in the year 2010. Sci Data 7, 112 (2020). doi:10.1038/s41597-020-0444-4
Spawn, S.A., and H.K. Gibbs. 2020. Global Aboveground and Belowground Biomass Carbon Density Maps for the Year 2010. ORNL DAAC, Oak Ridge, Tennessee, USA.
DOIs
Explore with Earth Engine
Code Editor (JavaScript)
var dataset = ee.ImageCollection('NASA/ORNL/biomass_carbon_density/v1');

var visualization = {
  bands: ['agb'],
  min: -50.0,
  max: 80.0,
  palette: ['d9f0a3', 'addd8e', '78c679', '41ab5d', '238443', '005a32']
};

Map.setCenter(-60.0, 7.0, 4);

Map.addLayer(dataset, visualization, 'Aboveground biomass carbon');