Page Summary
-
The FLDAS dataset is designed to assist with food security assessments in data-sparse, developing country settings by providing information on various climate-related variables.
-
This specific FLDAS dataset uses the Noah version 3.6.1 surface model with downscaled CHIRPS-6 hourly rainfall data and is available monthly from 1982 to 2025.
-
Data from the GES DISC archive, including this dataset, is available free to the user community for research, education, and nonprofit use.
- Dataset Availability
- 1982-01-01T00:00:00Z–2026-06-01T00:00:00Z
- Dataset Producer
- NASA GES DISC at NASA Goddard Space Flight Center
- Cadence
- 1 Month
- Tags
Description
The FLDAS dataset (McNally et al. 2017), was designed to assist with food security assessments in data-sparse, developing country settings. It includes information on many climate-related variables including moisture content, humidity, evapotranspiration, average soil temperature, total precipitation rate, etc.
There are multiple different FLDAS datasets; this one uses Noah version 3.6.1 surface model with CHIRPS-6 hourly rainfall that has been downscaled using the NASA Land Surface Data Toolkit. which is part of the Land Information System framework. Temporal desegregation is required so that daily rainfall inputs can be used in both energy and water balance calculations
For forcing data, this simulation uses a combination of the new version of Modern-Era Retrospective analysis for Research and Applications version 2 (MERRA-2) data and Climate Hazards Group InfraRed Precipitation with Station data (CHIRPS), a quasi-global rainfall dataset designed for seasonal drought monitoring and trend analysis (Funk et al., 2015).
Documentation:
Bands
Bands
Pixel size: 11132 meters (all bands)
| Name | Units | Pixel Size | Description |
|---|---|---|---|
Evap_tavg |
kg/m^2/s | 11132 meters | Evapotranspiration |
LWdown_f_tavg |
W/m^2 | 11132 meters | Downward longwave radiation flux |
Lwnet_tavg |
W/m^2 | 11132 meters | Net longwave radiation flux |
Psurf_f_tavg |
Pa | 11132 meters | Surface pressure |
Qair_f_tavg |
Mass fraction | 11132 meters | Specific humidity |
Qg_tavg |
W/m^2 | 11132 meters | Soil heat flux |
Qh_tavg |
W/m^2 | 11132 meters | Sensible heat net flux |
Qle_tavg |
W/m^2 | 11132 meters | Latent heat net flux |
Qs_tavg |
kg/m^2/s | 11132 meters | Storm surface runoff |
Qsb_tavg |
kg/m^2/s | 11132 meters | Baseflow-groundwater runoff |
RadT_tavg |
K | 11132 meters | Surface radiative temperature |
Rainf_f_tavg |
kg/m^2/s | 11132 meters | Total precipitation rate |
SnowCover_inst |
11132 meters | Snow cover fraction |
|
SnowDepth_inst |
m | 11132 meters | Snow depth |
Snowf_tavg |
kg/m^2/s | 11132 meters | Snowfall rate |
SoilMoi00_10cm_tavg |
Volume fraction | 11132 meters | Soil moisture (0 - 10 cm underground) |
SoilMoi10_40cm_tavg |
Volume fraction | 11132 meters | Soil moisture (10 - 40 cm underground) |
SoilMoi100_200cm_tavg |
Volume fraction | 11132 meters | Soil moisture (100 - 200 cm underground) |
SoilMoi40_100cm_tavg |
Volume fraction | 11132 meters | Soil moisture (40 - 100 cm underground) |
SoilTemp00_10cm_tavg |
K | 11132 meters | Soil temperature (0 - 10 cm underground) |
SoilTemp10_40cm_tavg |
K | 11132 meters | Soil temperature (10 - 40 cm underground) |
SoilTemp100_200cm_tavg |
K | 11132 meters | Soil temperature (100 - 200 cm underground) |
SoilTemp40_100cm_tavg |
K | 11132 meters | Soil temperature (40 - 100 cm underground) |
SWdown_f_tavg |
W/m^2 | 11132 meters | Surface downward shortwave radiation |
SWE_inst |
kg/m^2 | 11132 meters | Snow water equivalent |
Swnet_tavg |
W/m^2 | 11132 meters | Net shortwave radiation flux |
Tair_f_tavg |
K | 11132 meters | Near surface air temperature |
Wind_f_tavg |
m/s | 11132 meters | Near surface wind speed |
Terms of Use
Terms of Use
Distribution of data from the Goddard Earth Sciences Data and Information Services Center (GES DISC) is funded by NASA's Science Mission Directorate (SMD). Consistent with NASA Earth Science Data and Information Policy, data from the GES DISC archive are available free to the user community. For more information visit the GES DISC Data Policy page.
Citations
If you use these data in your research or applications, please include a reference in your publication(s) similar to the following example: Amy McNally NASA/GSFC/HSL (2018), FLDAS Noah Land Surface Model L4 Global Monthly 0.1 x 0.1 degree (MERRA-2 and CHIRPS), Greenbelt, MD, USA, Goddard Earth Sciences Data and Information Services Center (GES DISC), Accessed: [Data Access Date], doi:10.5067/5NHC22T9375G
McNally, A., Arsenault, K., Kumar, S., Shukla, S., Peterson, P., Wang, S., Funk, C., Peters-Lidard, C.D., & Verdin, J. P. (2017). A land data assimilation system for sub-Saharan Africa food and water security applications. Scientific Data, 4, 170012.
Explore with Earth Engine
Code Editor (JavaScript)
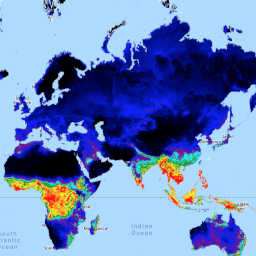
var dataset=ee.ImageCollection('NASA/FLDAS/NOAH01/C/GL/M/V001')
              .filter(ee.Filter.date('2018-11-01', '2018-12-01'));
var layer = dataset.select('Evap_tavg');

var band_viz = {
  min: 0.0,
  max: 0.00005,
  opacity: 1.0,
  palette: ['black', 'blue', 'purple', 'cyan', 'green', 'yellow', 'red']
};

Map.setCenter(30.0, 30.0, 2);
Map.addLayer(layer, band_viz, 'Average Evapotranspiration');
import ee
import geemap.core as geemap
Colab (Python)
dataset = ee.ImageCollection('NASA/FLDAS/NOAH01/C/GL/M/V001').filter(
    ee.Filter.date('2018-11-01', '2018-12-01')
)

layer = dataset.select('Evap_tavg')

band_viz = {
    'min': 0.0,
    'max': 0.00005,
    'opacity': 1.0,
    'palette': ['black', 'blue', 'purple', 'cyan', 'green', 'yellow', 'red'],
}

m = geemap.Map()
m.set_center(30.0, 30.0, 2)
m.add_layer(layer, band_viz, 'Average Evapotranspiration')
m