Page Summary
-
This dataset, the MCD12Q2 V6 Land Cover Dynamics product, provides global estimates of vegetation phenology and related EVI information derived from MODIS NBAR data.
-
The product identifies key vegetation cycle metrics, such as greenup, peak greenness, and dormancy, for up to two cycles per year.
-
It includes bands detailing the timing of these phenology events, EVI values, and quality information.
-
This dataset has been superseded by MODIS/061/MCD12Q2.
- Dataset Availability
- 2001-01-01T00:00:00Z–2019-01-01T00:00:00Z
- Dataset Producer
- NASA LP DAAC at the USGS EROS Center
- Cadence
- 1 Year
- Tags
Description
The MCD12Q2 V6 Land Cover Dynamics product (informally called the MODIS Global Vegetation Phenology product) provides estimates of the timing of vegetation phenology at global scales. Additionally, it provides information related to the range and summation of the enhanced vegetation index (EVI) computed from MODIS surface reflectance data at each pixel. It identifies the onset of greenness, greenup midpoint, maturity, peak greenness, senescence, greendown midpoint, dormancy, EVI2 minimum, EVI2 amplitude, integrated EVI2 over a vegetation cycle, as well as overall and phenology metric-specific quality information.
The MCD12Q2 Version 6 data product is derived from time series of the 2-band Enhanced Vegetation Index (EVI2) calculated from MODIS Nadir Bidirectional Reflectance Distribution Function (BRDF)-Adjusted Reflectance (NBAR). Vegetation phenology metrics are identified for up to two detected growing cycles per year. For pixels with more than two valid vegetation cycles, the data represent the two cycles with the largest NBAR-EVI2 amplitudes.
Bands
Pixel Size
500 meters
Bands
| Name | Min | Max | Scale | Pixel Size | Description | ||||||||||||||||||||||||||||||||||||||||||||||||||||||||||||||||||||||||||||||||||||||||||||||
|---|---|---|---|---|---|---|---|---|---|---|---|---|---|---|---|---|---|---|---|---|---|---|---|---|---|---|---|---|---|---|---|---|---|---|---|---|---|---|---|---|---|---|---|---|---|---|---|---|---|---|---|---|---|---|---|---|---|---|---|---|---|---|---|---|---|---|---|---|---|---|---|---|---|---|---|---|---|---|---|---|---|---|---|---|---|---|---|---|---|---|---|---|---|---|---|---|---|---|---|
NumCycles |
0 | 7 | meters | Total number of valid vegetation cycles with peak in product year |
|||||||||||||||||||||||||||||||||||||||||||||||||||||||||||||||||||||||||||||||||||||||||||||||
Greenup_1 |
11138 | 32766 | meters | Date when EVI2 first crossed 15% of the segment EVI2 amplitude, cycle 1. Days since Jan 1, 1970. |
|||||||||||||||||||||||||||||||||||||||||||||||||||||||||||||||||||||||||||||||||||||||||||||||
Greenup_2 |
11138 | 32766 | meters | Date when EVI2 first crossed 15% of the segment EVI2 amplitude, cycle 2. Days since Jan 1, 1970. |
|||||||||||||||||||||||||||||||||||||||||||||||||||||||||||||||||||||||||||||||||||||||||||||||
MidGreenup_1 |
11138 | 32766 | meters | Date when EVI2 first crossed 50% of the segment EVI2 amplitude, cycle 1. Days since Jan 1, 1970. |
|||||||||||||||||||||||||||||||||||||||||||||||||||||||||||||||||||||||||||||||||||||||||||||||
MidGreenup_2 |
11138 | 32766 | meters | Date when EVI2 first crossed 50% of the segment EVI2 amplitude, cycle 2. Days since Jan 1, 1970. |
|||||||||||||||||||||||||||||||||||||||||||||||||||||||||||||||||||||||||||||||||||||||||||||||
Peak_1 |
11138 | 32766 | meters | Date when EVI2 reached the segment maximum, cycle 1. Days since Jan 1, 1970. |
|||||||||||||||||||||||||||||||||||||||||||||||||||||||||||||||||||||||||||||||||||||||||||||||
Peak_2 |
11138 | 32766 | meters | Date when EVI2 reached the segment maximum, cycle 2. Days since Jan 1, 1970. |
|||||||||||||||||||||||||||||||||||||||||||||||||||||||||||||||||||||||||||||||||||||||||||||||
Maturity_1 |
11138 | 32766 | meters | Date when EVI2 first crossed 90% of the segment EVI2 amplitude, cycle 1. Days since Jan 1, 1970. |
|||||||||||||||||||||||||||||||||||||||||||||||||||||||||||||||||||||||||||||||||||||||||||||||
Maturity_2 |
11138 | 32766 | meters | Date when EVI2 first crossed 90% of the segment EVI2 amplitude, cycle 2. Days since Jan 1, 1970. |
|||||||||||||||||||||||||||||||||||||||||||||||||||||||||||||||||||||||||||||||||||||||||||||||
MidGreendown_1 |
11138 | 32766 | meters | Date when EVI2 last crossed 50% of the segment EVI2 amplitude, cycle 1. Days since Jan 1, 1970. |
|||||||||||||||||||||||||||||||||||||||||||||||||||||||||||||||||||||||||||||||||||||||||||||||
MidGreendown_2 |
11138 | 32766 | meters | Date when EVI2 last crossed 50% of the segment EVI2 amplitude, cycle 2. Days since Jan 1, 1970. |
|||||||||||||||||||||||||||||||||||||||||||||||||||||||||||||||||||||||||||||||||||||||||||||||
Senescence_1 |
11138 | 32766 | meters | Date when EVI2 last crossed 90% of the segment EVI2 amplitude, cycle 1. Days since Jan 1, 1970. |
|||||||||||||||||||||||||||||||||||||||||||||||||||||||||||||||||||||||||||||||||||||||||||||||
Senescence_2 |
11138 | 32766 | meters | Date when EVI2 last crossed 90% of the segment EVI2 amplitude, cycle 2. Days since Jan 1, 1970. |
|||||||||||||||||||||||||||||||||||||||||||||||||||||||||||||||||||||||||||||||||||||||||||||||
Dormancy_1 |
11138 | 32766 | meters | Date when EVI2 last crossed 15% of the segment EVI2 amplitude, cycle 1. Days since Jan 1, 1970. |
|||||||||||||||||||||||||||||||||||||||||||||||||||||||||||||||||||||||||||||||||||||||||||||||
Dormancy_2 |
11138 | 32766 | meters | Date when EVI2 last crossed 15% of the segment EVI2 amplitude, cycle 2. Days since Jan 1, 1970. |
|||||||||||||||||||||||||||||||||||||||||||||||||||||||||||||||||||||||||||||||||||||||||||||||
EVI_Minimum_1 |
0 | 10000 | 0.0001 | meters | Segment minimum EVI2 value, cycle 1 |
||||||||||||||||||||||||||||||||||||||||||||||||||||||||||||||||||||||||||||||||||||||||||||||
EVI_Minimum_2 |
0 | 10000 | 0.0001 | meters | Segment minimum EVI2 value, cycle 2 |
||||||||||||||||||||||||||||||||||||||||||||||||||||||||||||||||||||||||||||||||||||||||||||||
EVI_Amplitude_1 |
0 | 10000 | 0.0001 | meters | Segment maximum - minimum EVI2, cycle 1 |
||||||||||||||||||||||||||||||||||||||||||||||||||||||||||||||||||||||||||||||||||||||||||||||
EVI_Amplitude_2 |
0 | 10000 | 0.0001 | meters | Segment maximum - minimum EVI2, cycle 2 |
||||||||||||||||||||||||||||||||||||||||||||||||||||||||||||||||||||||||||||||||||||||||||||||
EVI_Area_1 |
0 | 3700 | 0.1 | meters | Sum of daily interpolated EVI2 from Greenup to Dormancy, cycle 1 |
||||||||||||||||||||||||||||||||||||||||||||||||||||||||||||||||||||||||||||||||||||||||||||||
EVI_Area_2 |
0 | 3700 | 0.1 | meters | Sum of daily interpolated EVI2 from Greenup to Dormancy, cycle 2 |
||||||||||||||||||||||||||||||||||||||||||||||||||||||||||||||||||||||||||||||||||||||||||||||
QA_Overall_1 |
0 | 3 | meters | QA code for entire segment, cycle 1 |
|||||||||||||||||||||||||||||||||||||||||||||||||||||||||||||||||||||||||||||||||||||||||||||||
QA_Overall_2 |
0 | 3 | meters | QA code for entire segment, cycle 2 |
|||||||||||||||||||||||||||||||||||||||||||||||||||||||||||||||||||||||||||||||||||||||||||||||
QA_Detailed_1 |
meters | Bit-packed, SDS-specific QA codes, cycle 1 |
|||||||||||||||||||||||||||||||||||||||||||||||||||||||||||||||||||||||||||||||||||||||||||||||||
QA_Detailed_2 |
meters | Bit-packed, SDS-specific QA codes, cycle 2 |
|||||||||||||||||||||||||||||||||||||||||||||||||||||||||||||||||||||||||||||||||||||||||||||||||
QA_Overall_1 Class Table
| Value | Color | Description |
|---|---|---|
| 0 | None | Best |
| 1 | None | Good |
| 2 | None | Fair |
| 3 | None | Poor |
QA_Overall_2 Class Table
| Value | Color | Description |
|---|---|---|
| 0 | None | Best |
| 1 | None | Good |
| 2 | None | Fair |
| 3 | None | Poor |
Terms of Use
Terms of Use
MODIS data and products acquired through the LP DAAC have no restrictions on subsequent use, sale, or redistribution.
Citations
Please visit LP DAAC 'Citing Our Data' page for information on citing LP DAAC datasets.
DOIs
Explore with Earth Engine
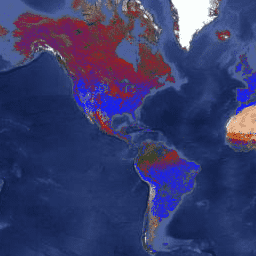
Code Editor (JavaScript)
var dataset = ee.ImageCollection('MODIS/006/MCD12Q2')
                  .filter(ee.Filter.date('2001-01-01', '2002-01-01'));
var vegetationPeak = dataset.select('Peak_1');
var vegetationPeakVis = {
  min: 11400,
  max: 11868,
  palette: ['0f17ff', 'b11406', 'f1ff23'],
};
Map.setCenter(6.746, 46.529, 2);
Map.addLayer(
    vegetationPeak, vegetationPeakVis,
    'Vegetation Peak 2001');