Page Summary
-
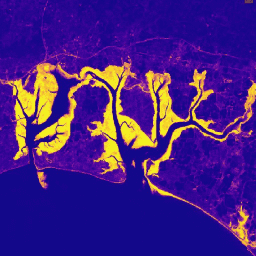
The Murray Global Tidal Wetland Change Dataset provides maps of global tidal wetland extent and their changes between 1999 and 2019.
-
This dataset classifies tidal wetlands into tidal marsh, tidal flat, or mangrove ecosystems and detects their change over the study period.
-
The dataset was created using observations from over a million Landsat satellite images combined with environmental data.
-
Bands in the dataset include information on tidal wetland loss and gain, the year of these changes, and the type of ecosystem affected.
- Dataset Availability
- 1999-01-01T00:00:00Z–2019-12-31T00:00:00Z
- Dataset Producer
- Murray/JCU
- Tags
Description
The Murray Global Tidal Wetland Change Dataset contains maps of the global extent of tidal wetlands and their change. The maps were developed from a three stage classification that sought to (i) estimate the global distribution of tidal wetlands (defined as either tidal marsh, tidal flat or mangrove ecosystems), (ii) detect their change over the study period, and (iii) estimate the ecosystem type and timing of tidal wetland change events.
The dataset was produced by combining observations from 1,166,385 satellite images acquired by Landsat 5 to 8 with environmental data of variables known to influence the distributions of each ecosystem type, including temperature, slope, and elevation. The image contains bands for a tidal wetland extent product (random forest probability of tidal wetland occurrence) for the start and end time-steps of the study period and a tidal wetland change product over the full study period (loss and gain of tidal wetlands).
Please see the usage notes on the project website. A full description of the methods, validation, and limitations of the data produced by this software is available in the associated scientific paper.
See also UQ/murray/Intertidal/v1_1/global_intertidal for global maps of the distribution of tidal flat ecosystems.
Bands
Bands
Pixel size: 30 meters (all bands)
| Name | Pixel Size | Description |
|---|---|---|
loss |
30 meters | Set to 1 for loss locations, masked out otherwise. |
lossYear |
30 meters | Integer representing the end year of the time-step of loss analysis (e.g., 19 = 2017-2019). |
lossType |
30 meters | Loss type
|
gain |
30 meters | Set to 1 for gain locations, masked out otherwise. |
gainYear |
30 meters | Integer representing the end year of the time-step of gain analysis (e.g., 19 = 2017-2019). |
gainType |
30 meters | Gain type:
|
twprobabilityStart |
30 meters | Random forest agreement of the overarching tidal wetland class for the first time step (1999-2001). Integer between 0 and 100. |
twprobabilityEnd |
30 meters | Random forest agreement of the overarching tidal wetland class for the last time step (2017-2019). Integer between 0 and 100. |
Terms of Use
Terms of Use
Citations
Murray, N.J., Worthington, T.A., Bunting, P., Duce, S., Hagger, V., Lovelock, C.E., Lucas, R., Saunders, M.I., Sheaves, M., Spalding, M., Waltham, N.J., Lyons, M.B., 2022. High-resolution mapping of losses and gains of Earth's tidal wetlands. Science. doi:10.1126/science.abm9583
DOIs
Explore with Earth Engine
Code Editor (JavaScript)
var dataset = ee.Image('JCU/Murray/GIC/global_tidal_wetland_change/2019');

Map.setCenter(103.7, 1.3, 12);
Map.setOptions('SATELLITE');

var plasma = [
  '0d0887', '3d049b', '6903a5', '8d0fa1', 'ae2891', 'cb4679', 'df6363',
  'f0844c', 'faa638', 'fbcc27', 'f0f921'
];
Map.addLayer(
    dataset.select('twprobabilityStart'), {palette: plasma, min: 0, max: 100},
    'twprobabilityStart', false, 1);
Map.addLayer(
    dataset.select('twprobabilityEnd'), {palette: plasma, min: 0, max: 100},
    'twprobabilityEnd', false, 1);

var lossPalette = ['fe4a49'];
var gainPalette = ['2ab7ca'];
Map.addLayer(
    dataset.select('loss'), {palette: lossPalette, min: 1, max: 1},
    'Tidal wetland loss', true, 1);
Map.addLayer(
    dataset.select('gain'), {palette: gainPalette, min: 1, max: 1},
    'Tidal wetland gain', true, 1);

var viridis = ['440154', '414487', '2a788e', '22a884', '7ad151', 'fde725'];
Map.addLayer(
    dataset.select('lossYear'), {palette: viridis, min: 4, max: 19},
    'Year of loss', false, 0.9);
Map.addLayer(
    dataset.select('gainYear'), {palette: viridis, min: 4, max: 19},
    'Year of gain', false, 0.9);

// Ecosystem type.
var classPalette = ['9e9d9d', 'ededed', 'ff9900', '009966', '960000', '006699'];
var classNames =
    ['null', 'null', 'Tidal flat', 'Mangrove', 'null', 'Tidal marsh'];
Map.addLayer(
    dataset.select('lossType'), {palette: classPalette, min: 0, max: 5},
    'Loss type', false, 0.9);
Map.addLayer(
    dataset.select('gainType'), {palette: classPalette, min: 0, max: 5},
    'Gain type', false, 0.9);