Page Summary
-
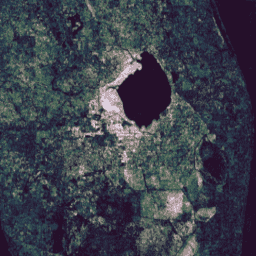
This dataset contains precomputed results from applying the Continuous Change Detection and Classification (CCDC) algorithm to 20 years of Landsat surface reflectance data.
-
The CCDC algorithm is a break-point finding method that uses harmonic fitting with a dynamic RMSE threshold to detect changes in time-series data.
-
The dataset was derived from Landsat 5, 7, and 8 Collection-1, Tier-1, surface reflectance data acquired between 1999 and 2019, with preprocessing applied to mask undesirable pixels.
-
Output pixels are encoded using variable length arrays where the outer length corresponds to the number of breakpoints found at that location.
-
Due to the nature of the output bands and downsampling, it is not recommended to use this dataset at resolutions less than 240m/pixel.

- Dataset Availability
- 1999-01-01T00:00:00Z–2020-01-01T00:00:00Z
- Dataset Producer
- Tags
Description
This collection contains precomputed results from running the Continuous Change Detection and Classification (CCDC) algorithm on 20 years of Landsat surface reflectance data. CCDC is a break-point finding algorithm that uses harmonic fitting with a dynamic RMSE threshold to detect breakpoints in time-series data.
The dataset was created from the Landsat 5, 7, and 8 Collection-1, Tier-1, surface reflectance time series, using all daytime images between 1999-01-01 and 2019-12-31. Each image was preprocessed to mask pixels identified as cloud, shadow, or snow (according to the 'pixel_qa' band), saturated pixels, and pixels with an atmospheric opacity > 300 (as identified by the 'sr_atmos_opacity' and 'sr_aerosol' bands). Pixels repeated in north/south scene overlap were deduplicated. The results were output in 2-degree tiles for all landmasses between -60° and +85° latitude. The images are suitable to simply mosaic() into one global image.
The CCDC algorithm was run with the default algorithm parameters except for the dateFormat:
- tmaskBands: ['green', 'swir']
- minObservations: 6
- chiSquareProbability: 0.99
- minNumOfYearsScaler: 1.33
- dateFormat: 1 (fractional year)
- lambda: 20
- maxIterations: 25000
Each pixel in the output is encoded using variable length arrays. The outer length of each array (axis 0) corresponds to the number of breakpoints found at that location. The coefs bands contain 2-D arrays, where each inner array contains the scaling factors for the 8 terms in the linear harmonic model, in the order: [offset, t, cos(ωt), sin(ωt), cos(2ωt), sin(2ωt), cos(3ωt), sin(3ωt)], where ω = 2Π. The models are scale to produce refelectance units (0.0 - 1.0) for the optical bands and degrees (K) / 100.0 for the thermal band.
Note that since the output bands are arrays and can only be downsampled using a SAMPLE pyramiding policy. At lower zoom levels, the results are usually no longer representative of the full-resolution data, and, for instance, tile boundaries can be seen due to the downsampled masks. It's therefore not recommended to use this dataset at resolutions less than 240m/pixel.
There are no current plans to add post-2019 assets to this dataset.
Bands
Pixel Size
30 meters
Bands
| Name | Pixel Size | Description |
|---|---|---|
tStart |
meters | 1-D Array containing the date of the start of each segment (fractional year). |
tEnd |
meters | 1-D Array containing the date of the end of each segment (fractional year). |
tBreak |
meters | 1-D Array containing the date of the detected breakpoint of each segment (fractional year). |
numObs |
meters | 1-D Array containing the number of observations found in each segment. |
changeProb |
meters | A pseudo-probability of the detected breakpoint being real. |
BLUE_coefs |
meters | 2-D array containing harmonic model coefficients for the blue band, for each segment. |
GREEN_coefs |
meters | 2-D array containing harmonic model coefficients for the green band, for each segment. |
RED_coefs |
meters | 2-D array containing harmonic model coefficients for the red band, for each segment. |
NIR_coefs |
meters | 2-D array containing harmonic model coefficients for the near-infrared band, for each segment. |
SWIR1_coefs |
meters | 2-D array containing harmonic model coefficients for the shortwave-infrared (1.55μm-1.75μm) band, for each segment. |
SWIR2_coefs |
meters | 2-D array containing harmonic model coefficients for the shortwave-infrared (2.09μm-2.35μm) band, for each segment. |
TEMP_coefs |
meters | 2-D array containing harmonic model coefficients for the thermal band, for each segment. |
BLUE_rmse |
meters | 1-D array containing the RMSE of the model for the blue band, for each segment. |
GREEN_rmse |
meters | 1-D array containing the RMSE of the model for the green band, for each segment. |
RED_rmse |
meters | 1-D array containing the RMSE of the model for the red band, for each segment. |
NIR_rmse |
meters | 1-D array containing the RMSE of the model for the near-infrared band, for each segment. |
SWIR1_rmse |
meters | 1-D array containing the RMSE of the model for the the shortwave-infrared (1.55μm-1.75μm) band, for each segment. |
SWIR2_rmse |
meters | 1-D array containing the RMSE of the model for the shortwave-infrared (2.09μm-2.35μm) band, for each segment. |
TEMP_rmse |
meters | 1-D array containing the RMSE of the model for the thermal band, for each segment. |
BLUE_magnitude |
meters | 1-D array containing the magnitude of the detected breakpoint for the blue band, for each segment. |
GREEN_magnitude |
meters | 1-D array containing the magnitude of the detected breakpoint for the green band, for each segment. |
RED_magnitude |
meters | 1-D array containing the magnitude of the detected breakpoint for the red band, for each segment. |
NIR_magnitude |
meters | 1-D array containing the magnitude of the detected breakpoint for the near-infrared band, for each segment. |
SWIR1_magnitude |
meters | 1-D array containing the magnitude of the detected breakpoint for the shortwave-infrared-1 (1.55μm-1.75μm) band, for each segment. |
SWIR2_magnitude |
meters | 1-D array containing the magnitude of the detected breakpoint for the shortwave-infrared-2 (2.09μm-2.35μm) band, for each segment. |
TEMP_magnitude |
meters | 1-D array containing the magnitude of the detected breakpoint for the thermal band, for each segment. |
Terms of Use
Terms of Use