1. Overview
This codelab will teach you how to add the Cast Debug Logger to your existing Custom Web Receiver app.
What is Google Cast?
The Google Cast SDK allows your app to play content and control playback on Google Cast-enabled devices. It provides you with the necessary UI components based on the Google Cast Design Checklist.
The Google Cast Design Checklist is provided to make the Cast user experience simple and predictable across all supported platforms.
What are we going to be building?
When you have completed this codelab, you will have a Custom Web Receiver integrated with the Cast Debug Logger.
See the Cast Debug Logger guide for details and more information.
What you'll learn
- How to set up your environment for Web Receiver development.
- How to integrate the Debug Logger into your Cast Receiver.
What you'll need
- The latest Google Chrome browser.
- HTTPS hosting service such as Firebase Hosting or ngrok.
- A Google Cast device such as a Chromecast or Android TV configured with internet access.
- A TV or monitor with HDMI input.
Experience
- You should have previous Cast experience and understand how a Cast Web Receiver works.
- You will need to have previous web development knowledge.
- You will also need previous knowledge of watching TV :)
How will you use this tutorial?
How would you rate your experience with building web apps?
How would you rate your experience with watching TV?
2. Get the sample code
You can download all the sample code to your computer...
and unpack the downloaded zip file.
3. Deploying your receiver locally
To be able to use your web receiver with a Cast device, it needs to be hosted somewhere where your Cast device can reach it. Should you already have a server available to you that supports https, skip the following instructions and make note of the URL, as you'll need it in the next section.
If you don't have a server available to use, you can use Firebase Hosting or ngrok.
Run the server
Once you have the service of your choice set up, navigate to app-start and start your server.
Make note of the URL for your hosted receiver. You will be using it in the next section.
4. Register an application in the Cast Developer Console
You must register your application to be able to run a custom Web Receiver, as built in this codelab, on Chromecast devices. After you've registered your application, you'll receive an application ID that your sender application must use to perform API calls, such as to launch a receiver application.
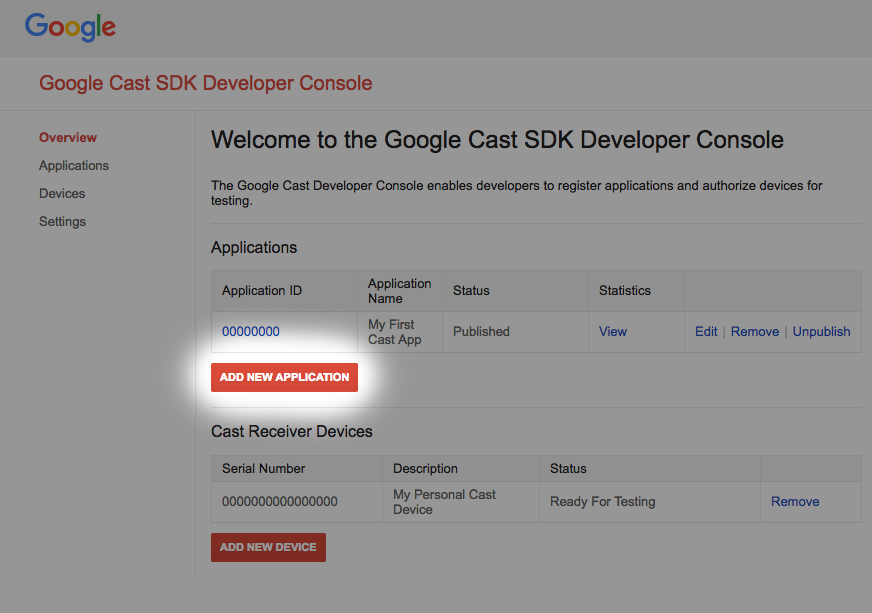
Click "Add new application"
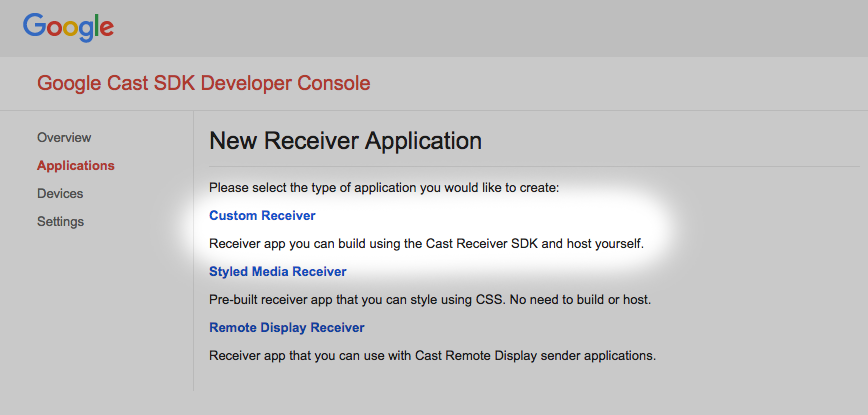
Select "Custom Receiver", this is what we're building.
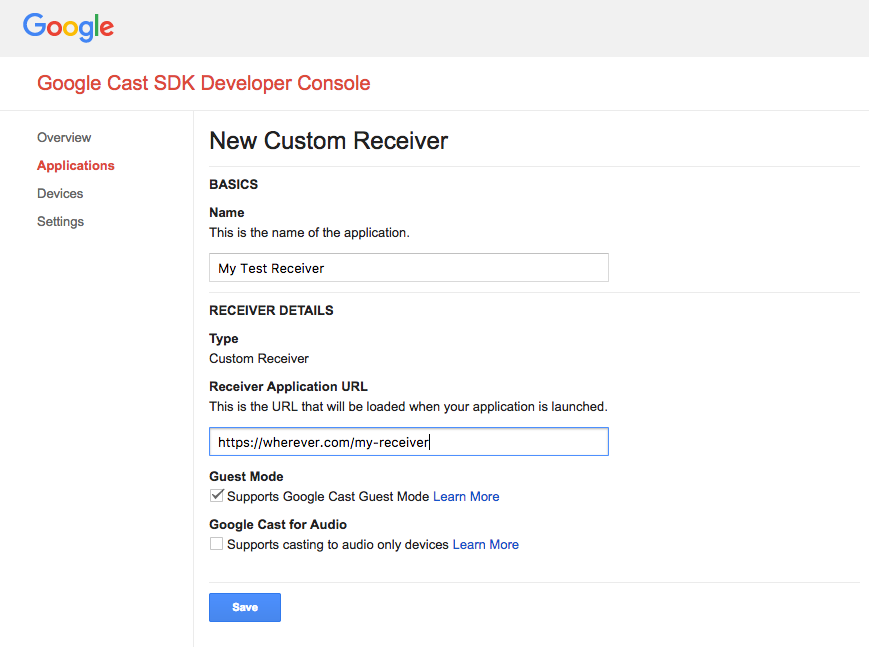
Enter the details of your new receiver, be sure to use the URL from the last section. Make a note of the Application ID assigned to your brand new receiver.
You must also register your Google Cast device so that it may access your receiver application before you publish it. Once you publish your receiver application, it will be available to all Google Cast devices. For the purpose of this codelab it's advised to work with an unpublished receiver application.
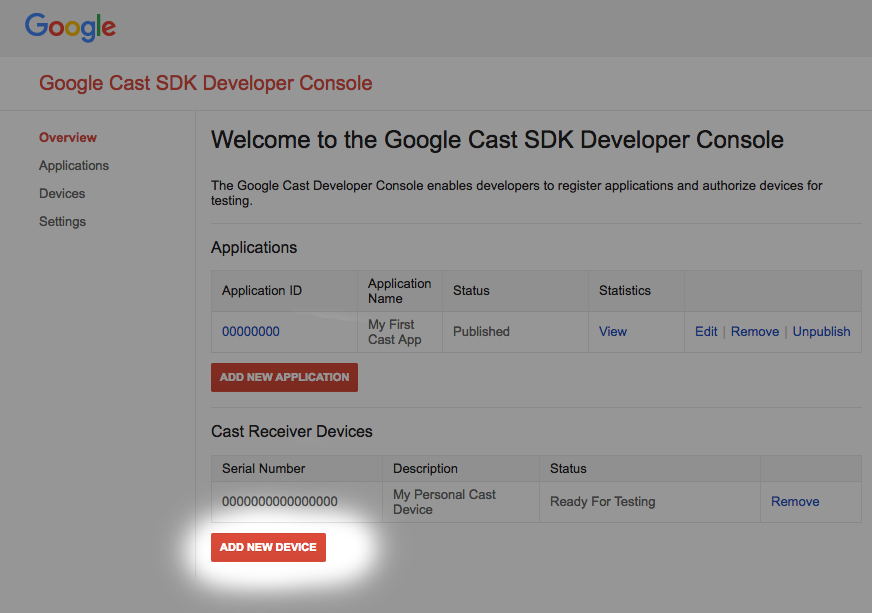
Click on "Add new Device"
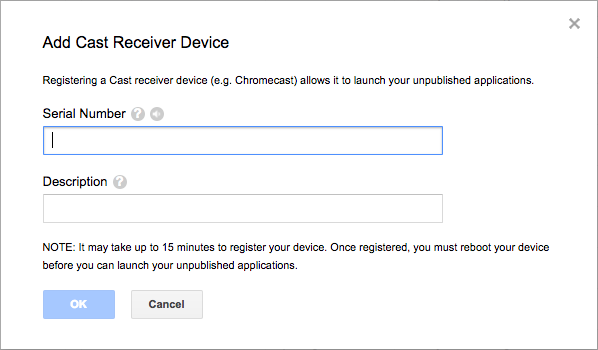
Enter the serial number printed on the back of your Cast device and give it a descriptive name. You can also find your serial number by casting your screen in Chrome when accessing Google Cast SDK Developer Console
It will take 5-15 minutes for your receiver and device to be ready for testing. After waiting 5-15 minutes you must reboot your Cast device.
5. Run the sample app
While we wait for our new Web Receiver to be ready for testing, let's see what a sample completed Web Receiver app looks like. The receiver we're going to build will be capable of playing back media using adaptive bitrate streaming.
- In your browser, open the Command and Control (CaC) Tool.
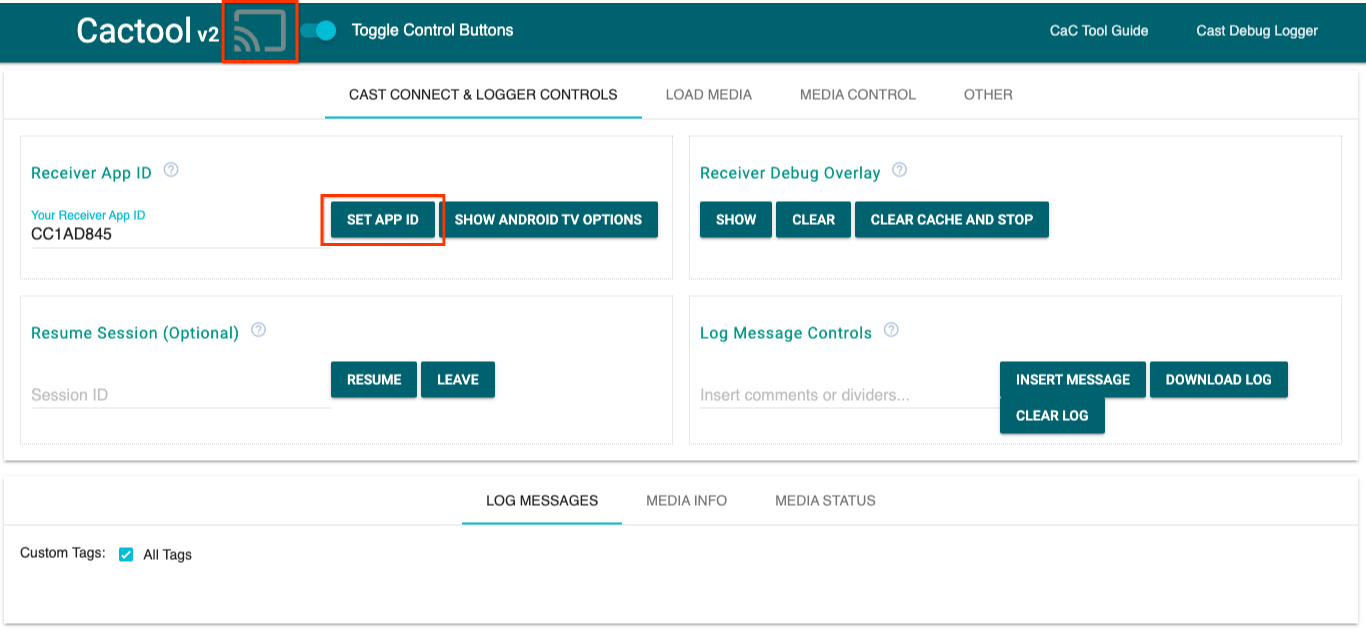
- Use the default
CC1AD845receiver ID and click theSET APP IDbutton. - Click the Cast button at the top left and select your Google Cast-enabled device.
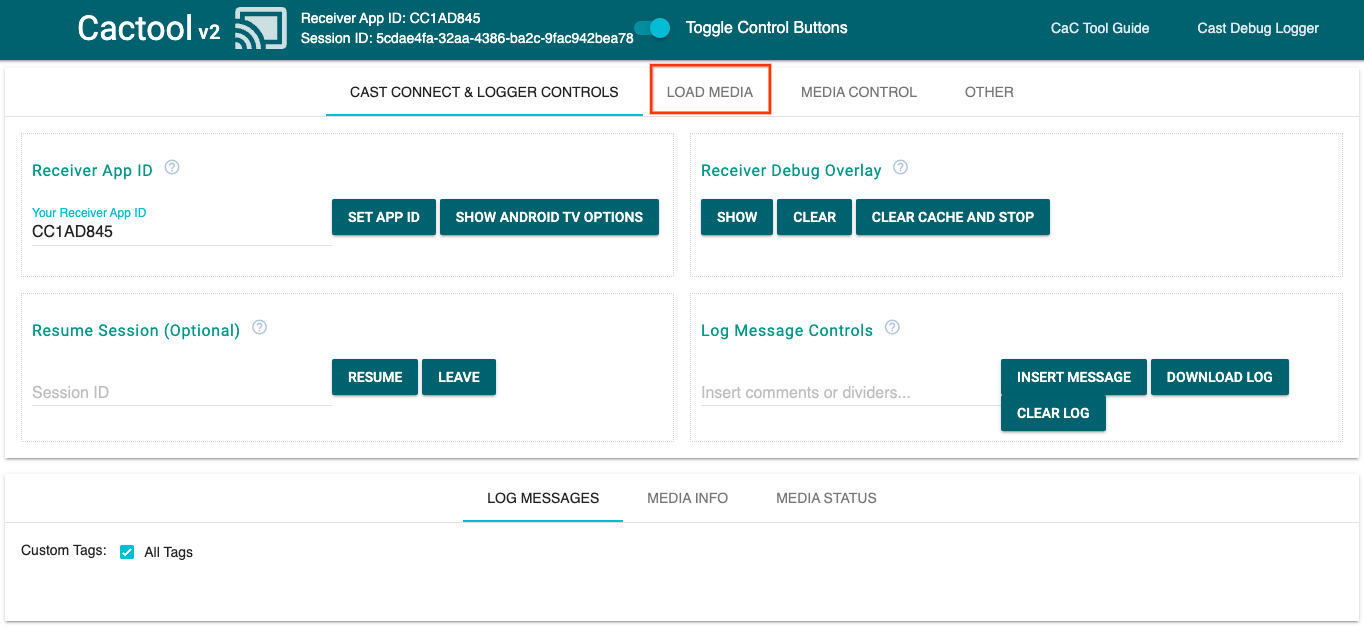
- Navigate to the
LOAD MEDIAtab at the top.
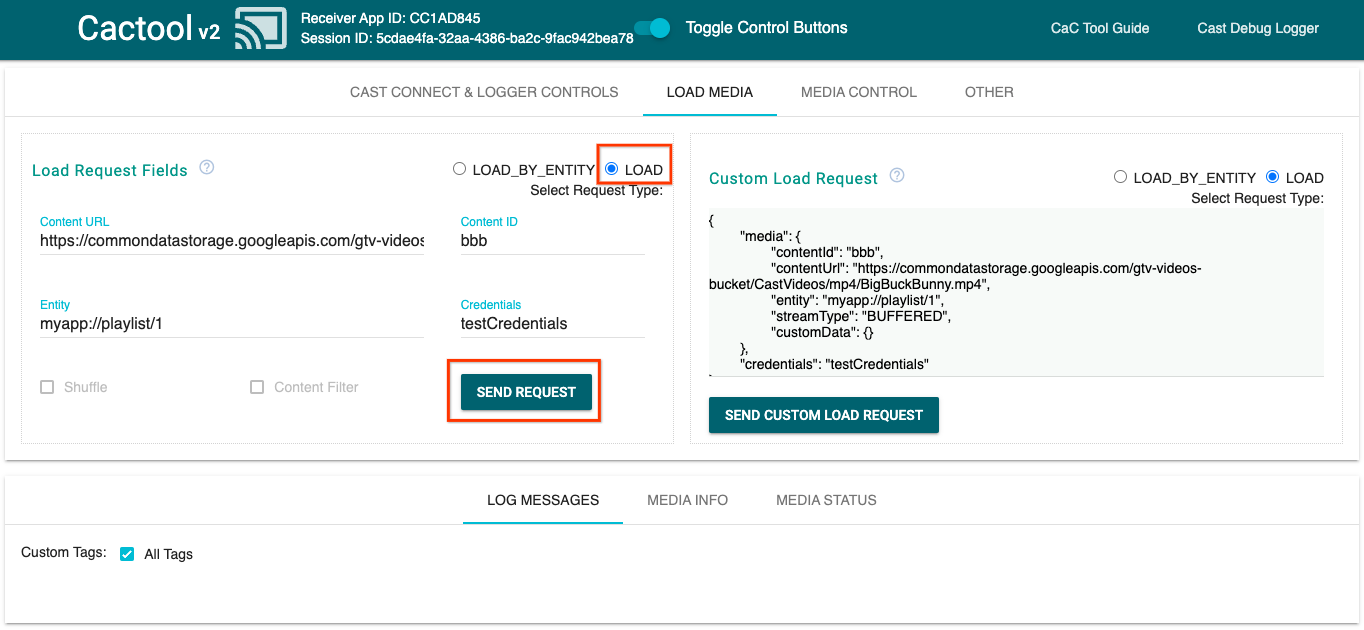
- Change the request type radio button to
LOAD. - Click the
SEND REQUESTbutton to play a sample video. - The video will start playing on your Google Cast-enabled device to show what basic receiver functionality looks like using the Default Receiver.
6. Prepare the start project
We need to add support for Google Cast to the start app you downloaded. Here are some Google Cast terminology that we will be using in this codelab:
- a sender app runs on a mobile device or laptop,
- a receiver app runs on the Google Cast or Android TV device.
Now you're ready to build on top of the starter project using your favorite text editor:
- Select the

app-startdirectory from your sample code download. - Open up
js/receiver.jsandindex.html
Note, as you're working through this codelab, http-server should be picking up changes you make. If it doesn't, try stopping and restarting http-server.
App Design
The receiver app initializes the Cast session and will standby until a LOAD request (such as the command to playback a piece of media) from a sender arrives.
The app consists of one main view, defined in index.html and one JavaScript file called js/receiver.js containing all the logic to make our receiver work.
index.html
This html file contains all of the UI for our receiver app.
receiver.js
This script manages all of the logic for our receiver app.
Frequently Asked Questions
7. Integrate with CastDebugLogger API
Cast Receiver SDK provides another option for developers to easily debug your receiver app by using the CastDebugLogger API.
See the Cast Debug Logger guide for details and more information.
Initialization
Include the following script in the <head> tag your receiver app right after the Web Receiver SDK script, in index.html:
<head>
  ...
  <script src="//www.gstatic.com/cast/sdk/libs/caf_receiver/v3/cast_receiver_framework.js"></script>
  <!-- Cast Debug Logger -->
  <script src="//www.gstatic.com/cast/sdk/libs/devtools/debug_layer/caf_receiver_logger.js"></script>
</head>
In js/receiver.js at the top of the file and below the playerManager, get the CastDebugLogger instance and enable the logger in a READY event listener:
const context = cast.framework.CastReceiverContext.getInstance();
const playerManager = context.getPlayerManager();
// Debug Logger
const castDebugLogger = cast.debug.CastDebugLogger.getInstance();
const LOG_TAG = 'MyAPP.LOG';
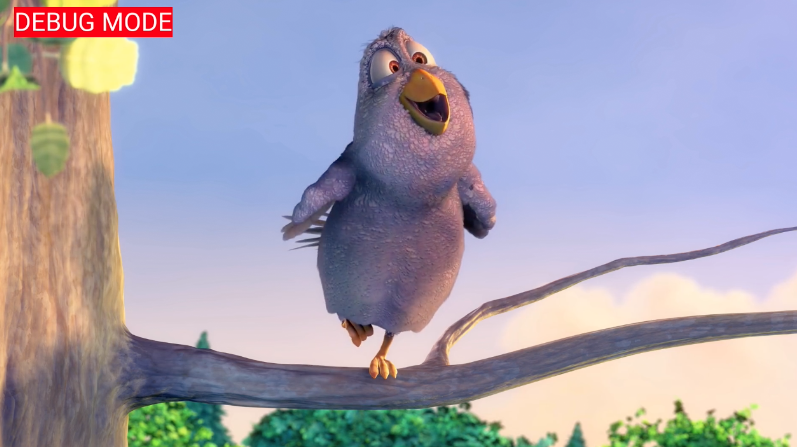
// Enable debug logger and show a 'DEBUG MODE' overlay at top left corner.
context.addEventListener(cast.framework.system.EventType.READY, () => {
if (!castDebugLogger.debugOverlayElement_) {
castDebugLogger.setEnabled(true);
}
});
When the debug logger is enabled, an overlay of DEBUG MODE is displayed on the receiver.
Log Player Events
Using CastDebugLogger you can easily log player events that are fired by the Cast Web Receiver SDK and use different logger levels to log the event data. The loggerLevelByEvents config takes cast.framework.events.EventType and cast.framework.events.category to specify the events to be logged.
Add the following below the READY event listener to log when the player CORE events are triggered or a mediaStatus change is broadcasted:
...

// Set verbosity level for Core events.
castDebugLogger.loggerLevelByEvents = {
  'cast.framework.events.category.CORE': cast.framework.LoggerLevel.INFO,
  'cast.framework.events.EventType.MEDIA_STATUS': cast.framework.LoggerLevel.DEBUG
};
Log Messages and Custom Tags
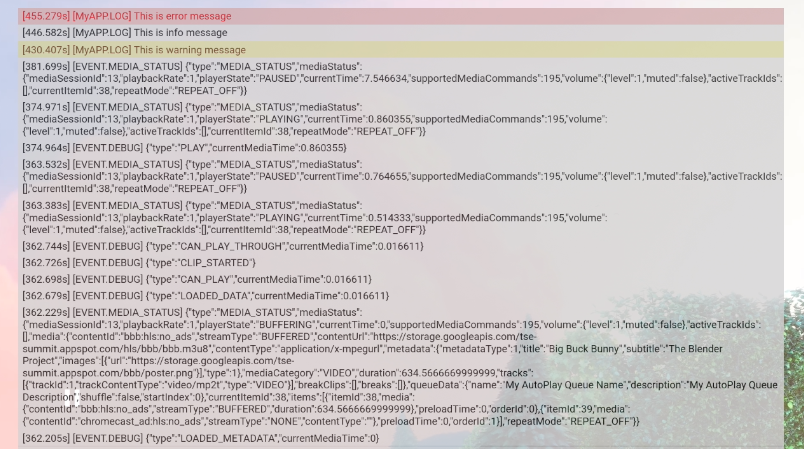
The CastDebugLogger API allows you to create log messages that appear on the receiver debug overlay with different colors. Use the following log methods, listed in order from highest to lowest priority:
castDebugLogger.error(custom_tag, message);castDebugLogger.warn(custom_tag, message);castDebugLogger.info(custom_tag, message);castDebugLogger.debug(custom_tag, message);
For each log method, the first parameter should be a custom tag and the second parameter is the log message. The tag can be any string that you find helpful.
To show logs in action, add logs to your LOAD interceptor.
playerManager.setMessageInterceptor(cast.framework.messages.MessageType.LOAD,
      loadRequestData => {
    // Listed in order from highest to lowest priority.
    castDebugLogger.error(LOG_TAG, 'Test error log');

    castDebugLogger.warn(LOG_TAG, 'Test warn log');

    castDebugLogger.info(LOG_TAG, 'Intercepting LOAD request', loadRequestData);

    castDebugLogger.debug(LOG_TAG, 'Test debug log');

    return loadRequestData;
  }
);
You can control which messages appear on the debug overlay by setting the log level in loggerLevelByTags for each custom tag. For example, enabling a custom tag with log level cast.framework.LoggerLevel.DEBUG would display all messages added with error, warn, info, and debug log messages. Another example is that enabling a custom tag with WARNING level would only display error and warn log messages.
The loggerLevelByTags config is optional. If a custom tag is not configured for its logger level, all log messages will display on the debug overlay.
Add the following below the loggerLevelByEvents call:
...

// Set verbosity level for custom tags.
castDebugLogger.loggerLevelByTags = {
    LOG_TAG: cast.framework.LoggerLevel.DEBUG, // display all levels
};

...
8. Using the Debug Overlay
The Cast Debug Logger provides a debug overlay on the receiver to show your custom log messages. Use showDebugLogs to toggle the debug overlay and clearDebugLogs to clear log messages on the overlay.
Add the following to the READY event listener to preview the debug overlay on your receiver:
// Enable debug logger and show a 'DEBUG MODE' overlay at top left corner.
context.addEventListener(cast.framework.system.EventType.READY, () => {
  if (!castDebugLogger.debugOverlayElement_) {
      castDebugLogger.setEnabled(true);

      // Show debug overlay.
      castDebugLogger.showDebugLogs(true);

      // Clear log messages on debug overlay.
      castDebugLogger.clearDebugLogs();
  }
});
9. Using the Command and Control (CaC) Tool
Overview
The Command and Control (CaC) Tool captures your logs and controls the debug overlay.
There are two ways to connect your receiver to the CaC Tool:
Start a new Cast connection:
- Open the CaC Tool, set the receiver App ID, and click on the Cast button to cast to the receiver.
- Cast a separate sender app to the same device with the same receiver App ID.
- Load media from the sender app and log messages will show on the tool.
Join an existing Cast session:
- Get the running Cast session id using receiver SDK or sender SDK. From the receiver side, enter the following to get session id in the Chrome Remote Debugger console:
cast.framework.CastReceiverContext.getInstance().getApplicationData().sessionId;
Or you can get the session id from a connected web sender, use the following method:
cast.framework.CastContext.getInstance().getCurrentSession().getSessionId();
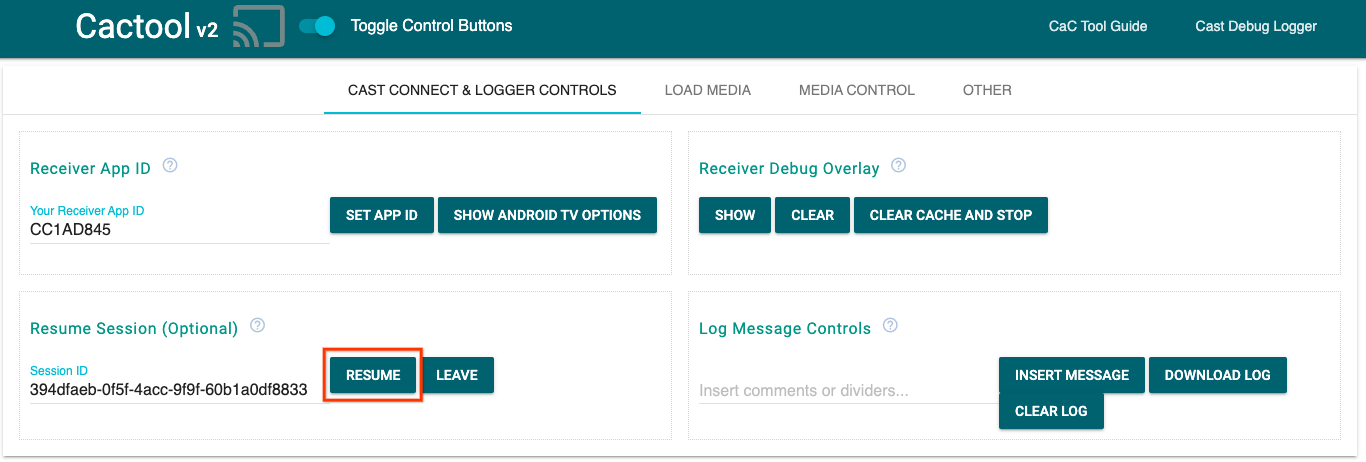
- Input the session id on the CaC Tool and click the
RESUMEbutton. - The Cast button should be connected and start showing log messages on the tool.
Things to Try
Next we will use the CaC Tool to see logs on your sample receiver.
- Open the CaC Tool.
- Enter the receiver App ID of your sample app and click the
SET APP IDbutton. - Click the Cast button at the top left and select your Google Cast-enabled device to open your receiver.
- Navigate to the
LOAD MEDIAtab at the top.
- Change the request type radio button to
LOAD. - Click the
SEND REQUESTbutton to play a sample video.
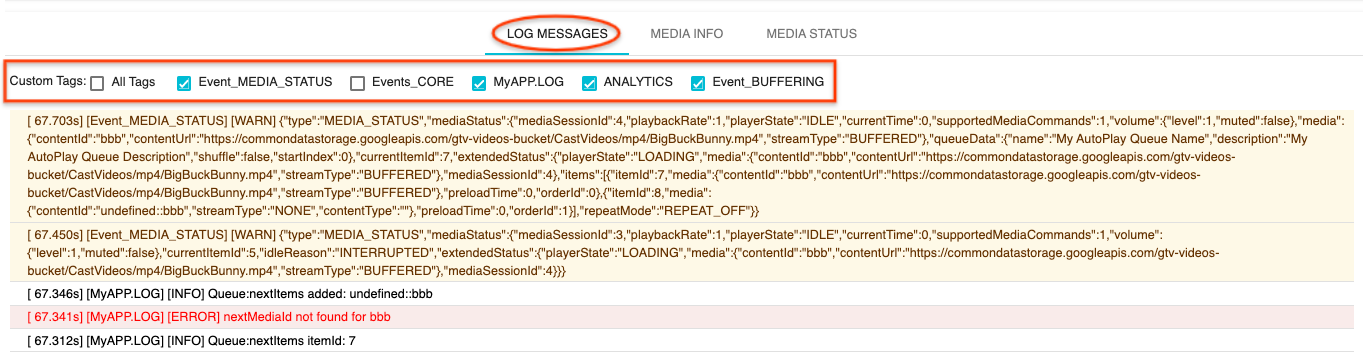
- A sample video should now be playing on your device. You should start seeing your logs from the previous steps start to display in the "Log Messages" tab at the bottom of the tool.
Try exploring the following features to investigate logs and control the receiver:
- Click the
MEDIA INFOorMEDIA STATUStab to see the media information and media status. - Click the
SHOW OVERLAYbutton to see a debug overlay on receiver. - Use the
CLEAR CACHE AND STOPbutton to reload the receiver app and cast again.
10. Congratulations
You now know how to add the Cast Debug Logger to your Cast-enabled Web Receiver app using the latest Cast Receiver SDK.
For more details, see the Cast Debug Logger and Command and Control (CaC) Tool developer guides.