في 13 أيلول (سبتمبر) 2022، تم إيقاف الإحصاءات في وحدة تحكّم المهام المتعلّقة بالمهام المتعلّقة بالمحادثات. للتعرّف على مزيد من المعلومات، يُرجى الاطّلاع على نظرة عامة على إنهاء إجراءات المحادثة.
تنظيم صفحاتك في مجموعات
يمكنك حفظ المحتوى وتصنيفه حسب إعداداتك المفضّلة.
في حال فشل مشروع Actions أو بدا أنه يعمل بشكل سيئ، فقد لا يكون سبب المشكلة واضحًا. من وحدة تحكم الإجراءات، يمكنك عرض السجلات التفصيلية لمشروعك والتي يمكن أن تمنحك المزيد من الإحصاءات حول ما يجري.
عرض سجلات مشروعك
يمكن الوصول إلى سجلات مشروعك من خلال "وحدة تحكّم الإجراءات" ضمن "إحصاءات Google":
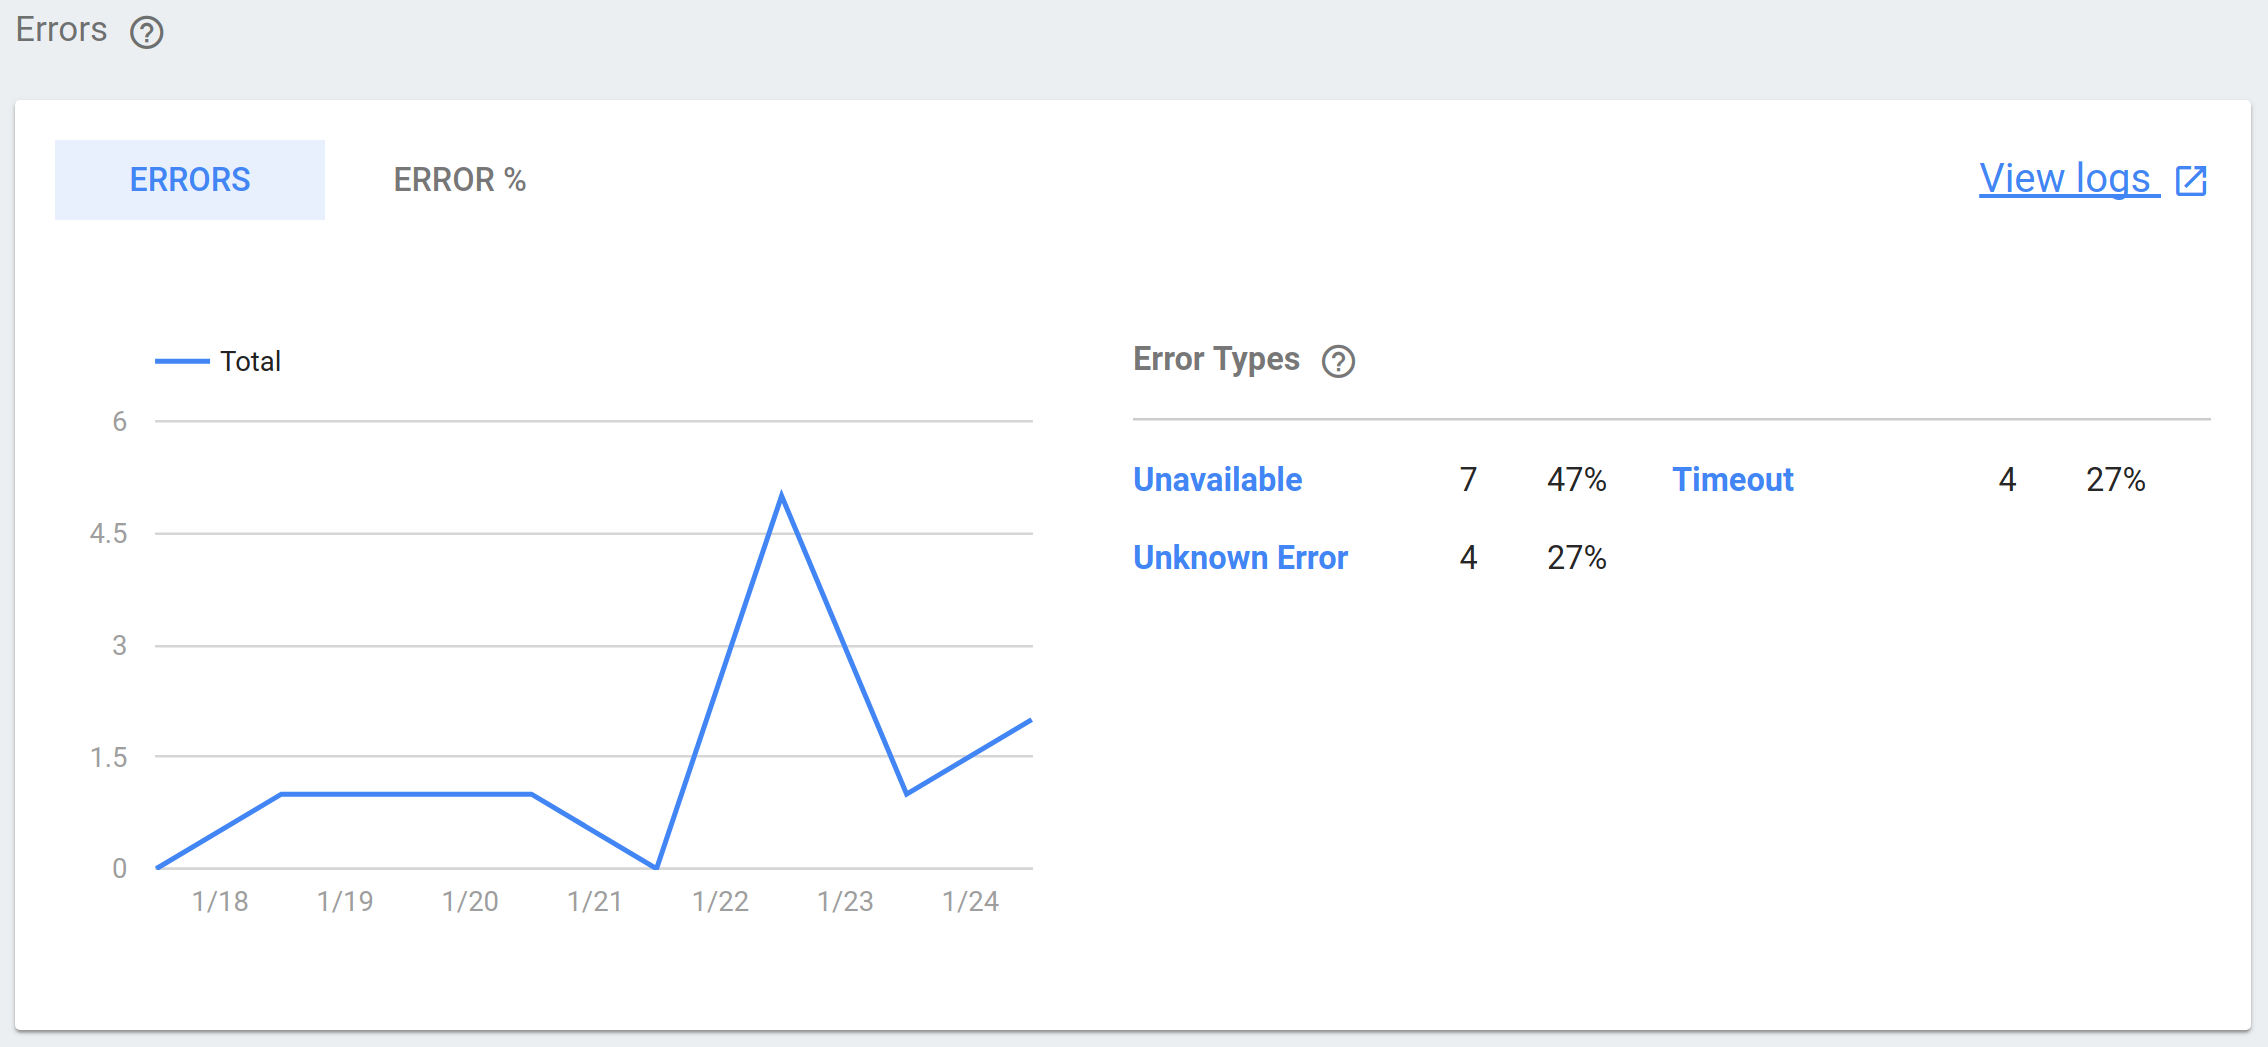
انقر على علامة التبويب Health (صحة) بالقرب من أعلى الصفحة.
ضمن الأخطاء، اختَر الرابط عرض السجلات في أعلى يسار الصفحة:
سينقلك هذا الرابط إلى سجلات مشروعك في Google Cloud Platform،
حيث يمكنك تصفية بيانات السجل التي تم جمعها وتوسيعها وتحليلها.
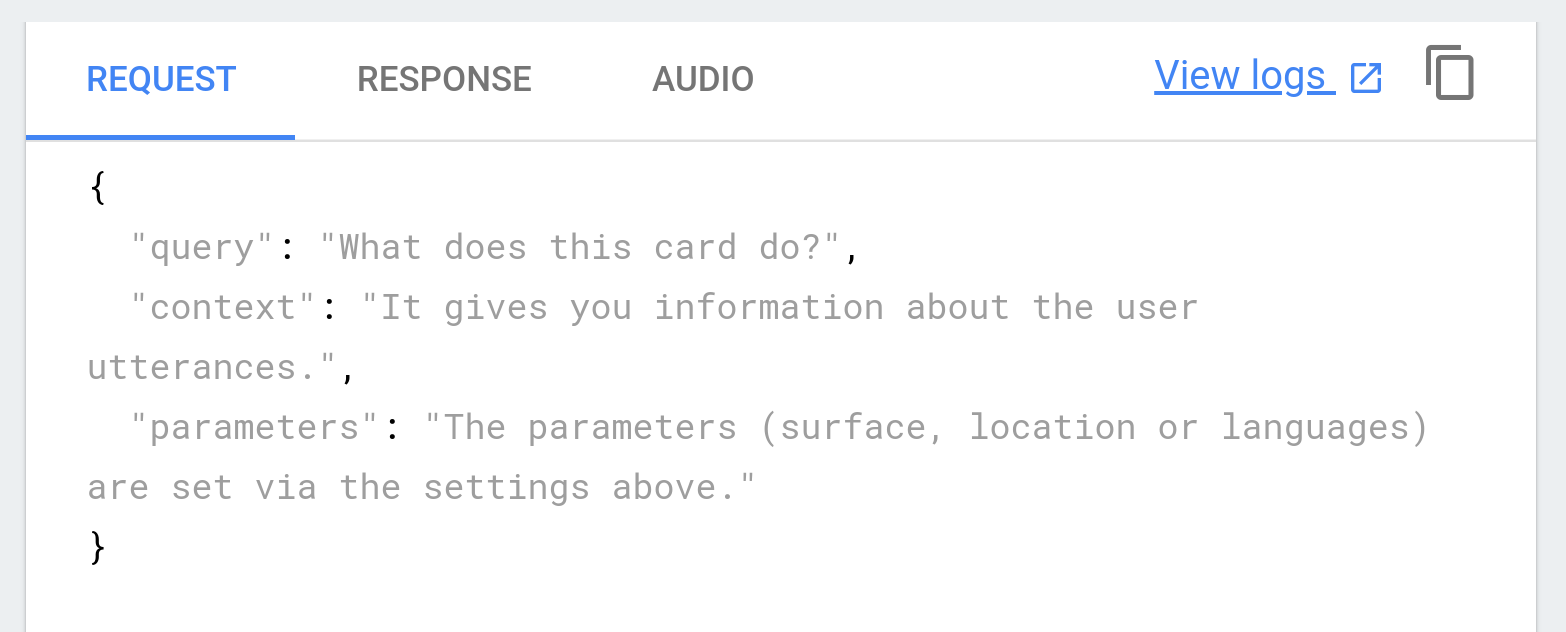
إذا كنت تستخدم محاكي الإجراءات لاختبار إجراءاتك، فيمكنك الوصول بسرعة إلى السجلات الخاصة باختباراتك من خلال النقر على الرابط عرض
السجلات في الزاوية العلوية اليسرى من صفحة محاكي الإجراءات.
تحديد المشاكل وحلّها
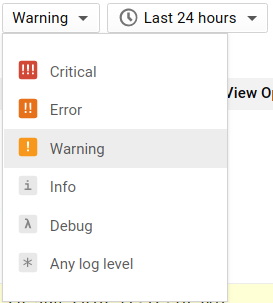
يتم وضع علامة على إدخالات السجلّ بمستويات تشير إلى الاستعجال. إذا كنت تحرِّر مشكلة ما في مشروع الإجراءات وإصلاحها، من المحتمل أن تريد البدء بالفلترة بحثًا عن الأحداث الفادحة والأخطاء والتحذير:
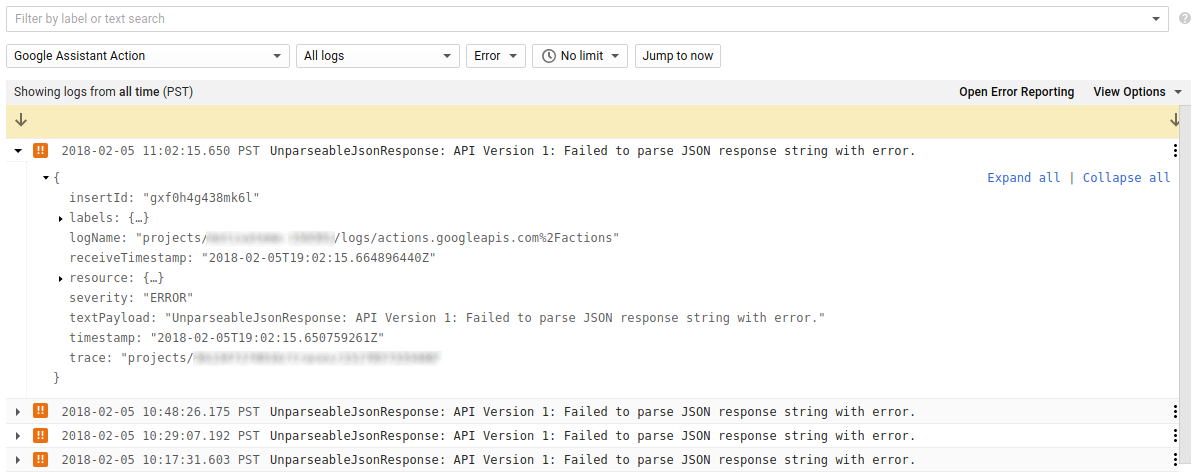
يحتوي كل إدخال في السجل على ملخص يتضمن طابعًا زمنيًا ووصفًا موجزًا
للحدث. يمكنك ربط سلوك مشروعك بالطوابع الزمنية للسجل
هذه لتحديد ما إذا كانت مرتبطة ببعضها، والإشارة إلى الوصف لتضييق
نطاق السبب.
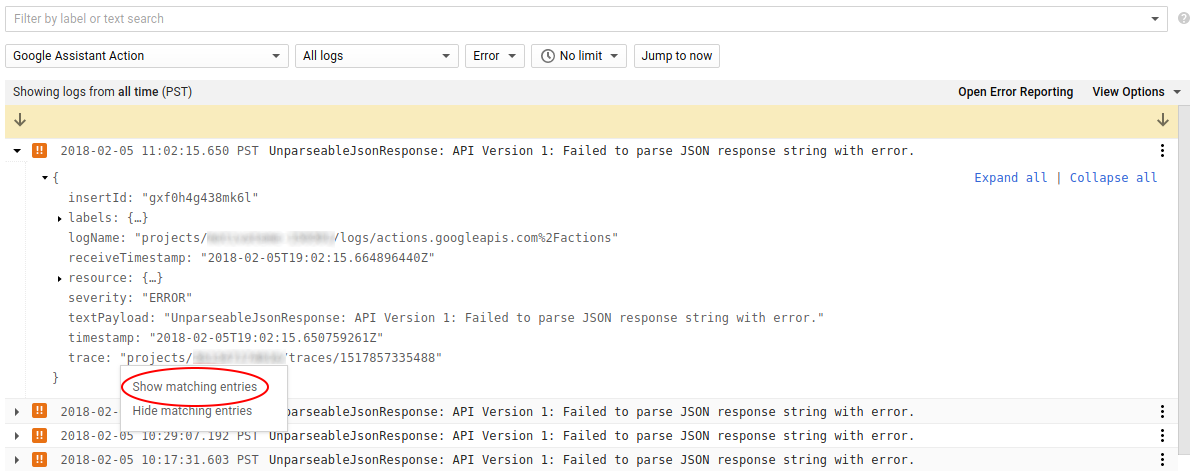
في المثال أدناه، تم عرض خطأ UnparseableJsonResponse، ومن المحتمل أن يكون ذلك نتيجة خطأ في البنية أو المهلة عند تلقّي استجابة JSON هذه من الرد التلقائي على الويب:
ننصحك أيضًا بالبحث عن أحداث تصحيح الأخطاء التي لها طابع زمني مشابه، لأنّها
قد تتضمّن معلومات إضافية عن أحداث أخرى. من خلال توسيع سجلّ الأخطاء والفلترة حسب الحقل trace، ستعرض القائمة الناتجة جميع الأحداث المرتبطة بالخطأ الأولي:
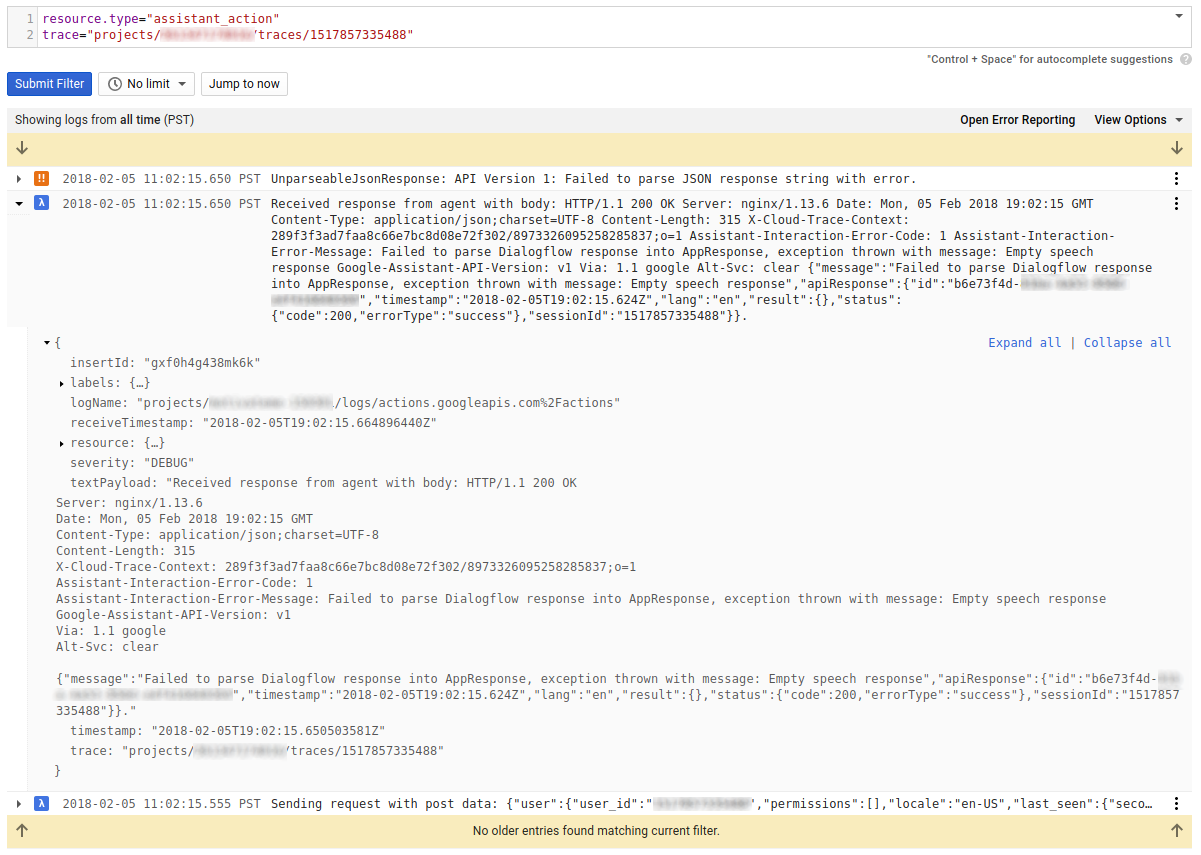
في المثال أدناه، تقدّم لنا رسائل تصحيح الأخطاء المرتبطة بالخطأ الأصلي معلومات إضافية حول المشكلة، بما في ذلك وصف تفصيلي للخطأ واستجابة JSON المحدّدة التي تسببت في حدوث المشكلة:
إيقاف أنواع السجلّات
نظرًا لأن سجلات مشروعك شاملة، فقد تجد أنه من المفيد استبعاد أنواع معينة من الأحداث من الظهور في سجلاتك بشكل افتراضي (مثل الأحداث التي تتضمن معلومات تحديد الهوية الشخصية أو الأحداث التي تعتبرها غير مكلفة). يمكنك إنشاء
استبعادات على صفحة سجلّ المشروع عن طريق الانتقال إلى استخدام الموارد على
شريط التنقل الأيسر واختيار علامة تبويب الاستبعادات:
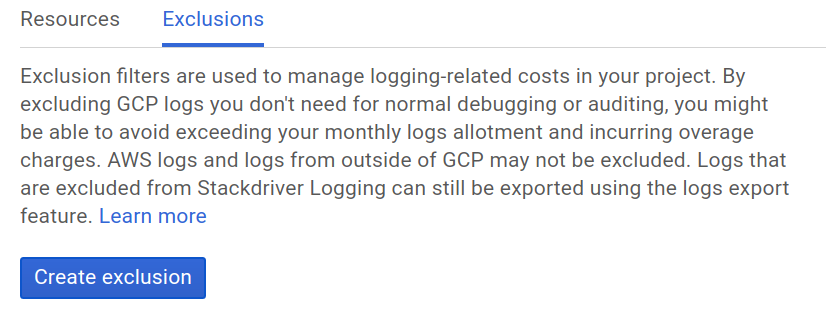
يمكنك الاطّلاع على مزيد من المعلومات حول استبعاد أحداث سجلات مختلفة على الرابط Excluding
Logs في مستندات
Stackdriver.
تاريخ التعديل الأخير: 2025-07-26 (حسب التوقيت العالمي المتفَّق عليه)
[[["يسهُل فهم المحتوى.","easyToUnderstand","thumb-up"],["ساعَدني المحتوى في حلّ مشكلتي.","solvedMyProblem","thumb-up"],["غير ذلك","otherUp","thumb-up"]],[["لا يحتوي على المعلومات التي أحتاج إليها.","missingTheInformationINeed","thumb-down"],["الخطوات معقدة للغاية / كثيرة جدًا.","tooComplicatedTooManySteps","thumb-down"],["المحتوى قديم.","outOfDate","thumb-down"],["ثمة مشكلة في الترجمة.","translationIssue","thumb-down"],["مشكلة في العيّنات / التعليمات البرمجية","samplesCodeIssue","thumb-down"],["غير ذلك","otherDown","thumb-down"]],["تاريخ التعديل الأخير: 2025-07-26 (حسب التوقيت العالمي المتفَّق عليه)"],[[["\u003cp\u003eView detailed logs for your Actions project in the Actions Console to gain insight into potential issues.\u003c/p\u003e\n"],["\u003cp\u003eAccess project logs through the \u003cstrong\u003eHealth\u003c/strong\u003e tab in \u003cstrong\u003eAnalytics\u003c/strong\u003e, which redirects to Google Cloud Platform for analysis.\u003c/p\u003e\n"],["\u003cp\u003eUtilize log levels (Critical, Error, Warning) and timestamps to identify and troubleshoot problems within your project.\u003c/p\u003e\n"],["\u003cp\u003eFilter logs using the \u003ccode\u003etrace\u003c/code\u003e field to view associated events for a more comprehensive understanding of errors.\u003c/p\u003e\n"],["\u003cp\u003eCustomize log visibility by creating exclusions to remove specific event types, like those containing sensitive information.\u003c/p\u003e\n"]]],[],null,["# Troubleshooting your Actions\n\nIn the event that your Actions project fails or seems to be working poorly, the cause of\nthe issue may not be obvious. From the [Actions\nconsole](https://console.actions.google.com), you can view detailed logs for\nyour project that can give you more insight into what's going on.\n\nView your project's logs\n------------------------\n\nYour project's logs can be accessed via the Actions Console under Analytics:\n\n1. On your project in the [Actions\n console](https://console.actions.google.com), select **Analytics** in the top menu.\n2. Select the **Health** tab near the top of the page.\n3. Under **Errors** , select the **View Logs** link on the upper-right corner:\n\nThis link will take you to your project's logs in the Google Cloud Platform,\nwhere you can filter, expand, and analyze the log data that has been collected.\n| **Note:** The logs for your Actions on Google project are generated using Stackdriver Logging, which offers log management and analytics. You can learn more about how to navigate your project's logs at [Viewing\n| Logs](https://cloud.google.com/logging/docs/view/overview) on the Stackdriver documentation. Note that not every filter described in those docs are currently available for Actions on Google projects.\n\nIf you're using the [Actions Simulator](/assistant/console/simulator) to test your\nActions, you can quickly access logs specific to your tests by clicking the **View\nLogs** link on the upper-right corner of the Actions Simulator page.\n\nTroubleshooting\n---------------\n\nLog entries are marked with levels that indicate urgency. If you're\ntroubleshooting a problem with your Actions project, you will probably\nwant to start by filtering for *Critical* , *Error* , and *Warning* events:\n\nEvery log entry has a summary that includes a timestamp and short description\nof the event. You can correlate your project's behavior with these log timestamps\nto determine if they are related, and reference the description to narrow down\nthe cause.\n\nIn the example below, an `UnparseableJsonResponse` error was returned, likely\nas the result of a syntax or timeout error when recieving this JSON response\nfrom the webhook:\n\nYou may also want to look for *Debug* events with a similar timestamp, as they\ncan include additional information about other events. By expanding an error log\nand filtering by the `trace` field, the resulting list will show you all\nevents associated with the initial error:\n\n| **Note:** If the resulting trace filter doesn't show any additional results beyond the initial log, see if there is a *severity* line in the filter and try removing it.\n\nIn the example below, the debug messages associated with the original\nerror give us additional information about the issue, including a detailed\nerror description and the specific JSON response that caused the issue:\n\nDisabling log types\n-------------------\n\nSince the logs for your project are comprehensive, you may find it valuable to\nexclude certain event types from appearing in your logs by default (such as\nevents with PII or events that you deem to be clutter). You can create\nexclusions on your project's log page by navigating to **Resource usage** on the\nleft navigation bar and selecting the **Exclusions** tab:\n\nYou can learn more about excluding different log events at [Excluding\nLogs](https://cloud.google.com/logging/docs/exclusions) on the Stackdriver\ndocumentation."]]