Page Summary
-
Project logs in the Actions Console under Analytics can help you troubleshoot issues with your Actions project.
-
You can access detailed logs through the Actions console by navigating to Analytics, Health, and then clicking View Logs under Errors.
-
For troubleshooting, start by filtering logs for Critical, Error, and Warning events, and use timestamps and descriptions to identify causes.
-
Debug events can provide additional context for errors when expanded and filtered by the
tracefield. -
You can disable certain log types by creating exclusions on your project's log page under Resource usage.
In the event that your Actions project fails or seems to be working poorly, the cause of the issue may not be obvious. From the Actions console, you can view detailed logs for your project that can give you more insight into what's going on.
View your project's logs
Your project's logs can be accessed via the Actions Console under Analytics:
- On your project in the Actions console, select Analytics in the top menu.
- Select the Health tab near the top of the page.
- Under Errors, select the View Logs link on the upper-right corner:

This link will take you to your project's logs in the Google Cloud Platform, where you can filter, expand, and analyze the log data that has been collected.
If you're using the Actions Simulator to test your Actions, you can quickly access logs specific to your tests by clicking the View Logs link on the upper-right corner of the Actions Simulator page.

Troubleshooting
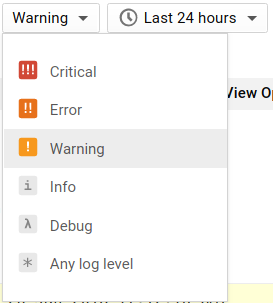
Log entries are marked with levels that indicate urgency. If you're troubleshooting a problem with your Actions project, you will probably want to start by filtering for Critical, Error, and Warning events:
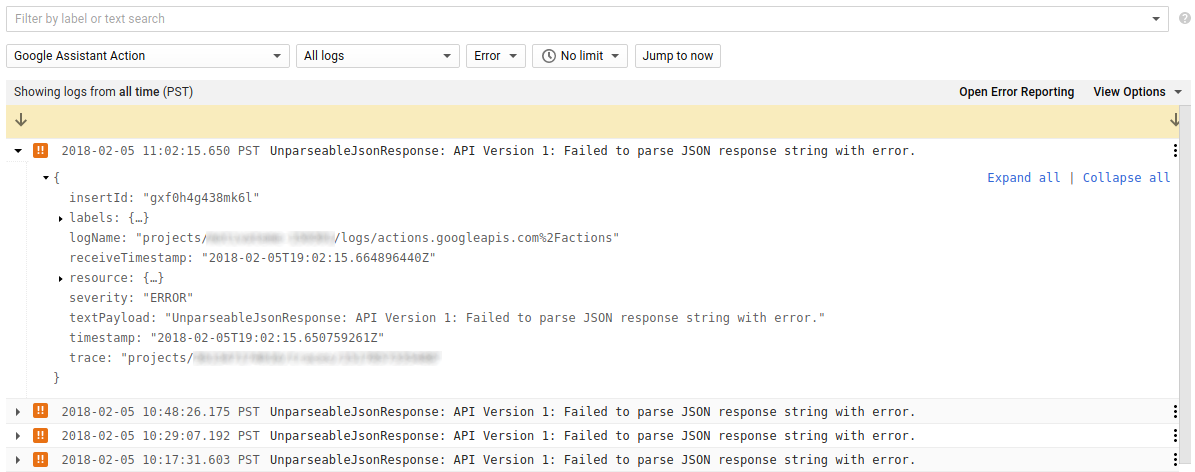
Every log entry has a summary that includes a timestamp and short description of the event. You can correlate your project's behavior with these log timestamps to determine if they are related, and reference the description to narrow down the cause.
In the example below, an UnparseableJsonResponse error was returned, likely
as the result of a syntax or timeout error when recieving this JSON response
from the webhook:
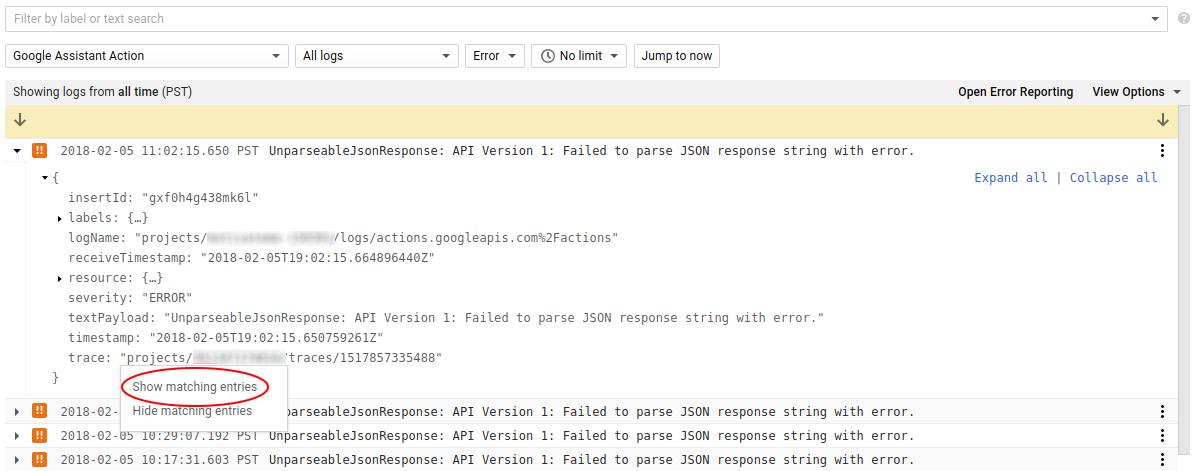
You may also want to look for Debug events with a similar timestamp, as they
can include additional information about other events. By expanding an error log
and filtering by the trace field, the resulting list will show you all
events associated with the initial error:
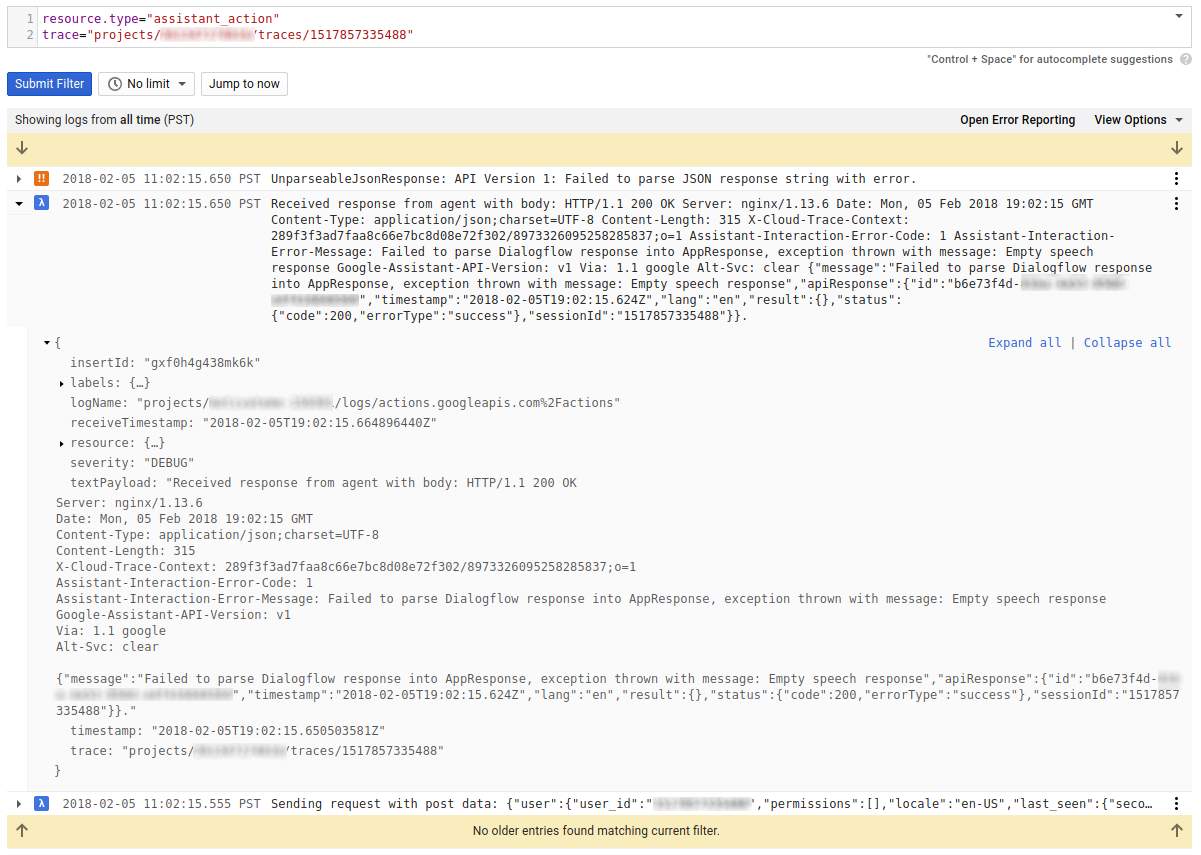
In the example below, the debug messages associated with the original error give us additional information about the issue, including a detailed error description and the specific JSON response that caused the issue:
Disabling log types
Since the logs for your project are comprehensive, you may find it valuable to exclude certain event types from appearing in your logs by default (such as events with PII or events that you deem to be clutter). You can create exclusions on your project's log page by navigating to Resource usage on the left navigation bar and selecting the Exclusions tab:
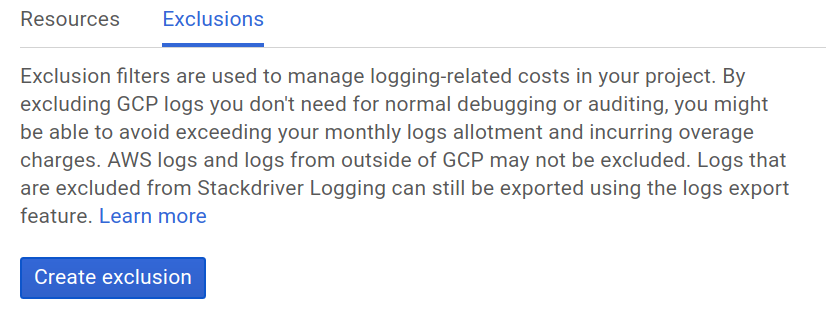
You can learn more about excluding different log events at Excluding Logs on the Stackdriver documentation.
