
請務必定期查看您的 Google 地圖平台 API 用量、配額和帳單資訊。這些資訊可協助您評估 API 用量、避免超出預定的使用限制,以及規劃預算來控管費用。此外,查看這些資訊也有助您掌握應用程式和 Google 地圖平台服務之間,是否有任何非預期的互動。
Google 地圖平台提供兩種工具,方便您查看用量、配額和帳單資訊:
- 報表:透過一組預先定義的視覺化報表,輕鬆查看 Google Cloud 控制台中的基本 API 用量、配額和帳單資訊。此外,您還可迅速確認 API 呼叫的數量、查看剩餘的 API 用量配額,以及持續監控帳單用量。
監控:運用 Cloud 控制台和 API 提供的一組工具,監控 API 用量、配額和帳單資訊,還可以指定相關快訊,在上述任一指標接近預先定義的上限時顯示。
您可以運用 Monitoring 建立自訂的監控資訊主頁,並透過各種圖表呈現指標。您也可設定在指標超過預定門檻時,以電子郵件或簡訊等方式發出快訊通知。
報表
Google 地圖平台的報表是一組預先定義的視覺化報表,可讓您輕鬆查看 Google Cloud 控制台中的基本 API 用量、配額和帳單資訊。您可以使用 Cloud 控制台,查看 Google 地圖平台 API 用量、配額和帳單金額相關報表。
API 和服務報表
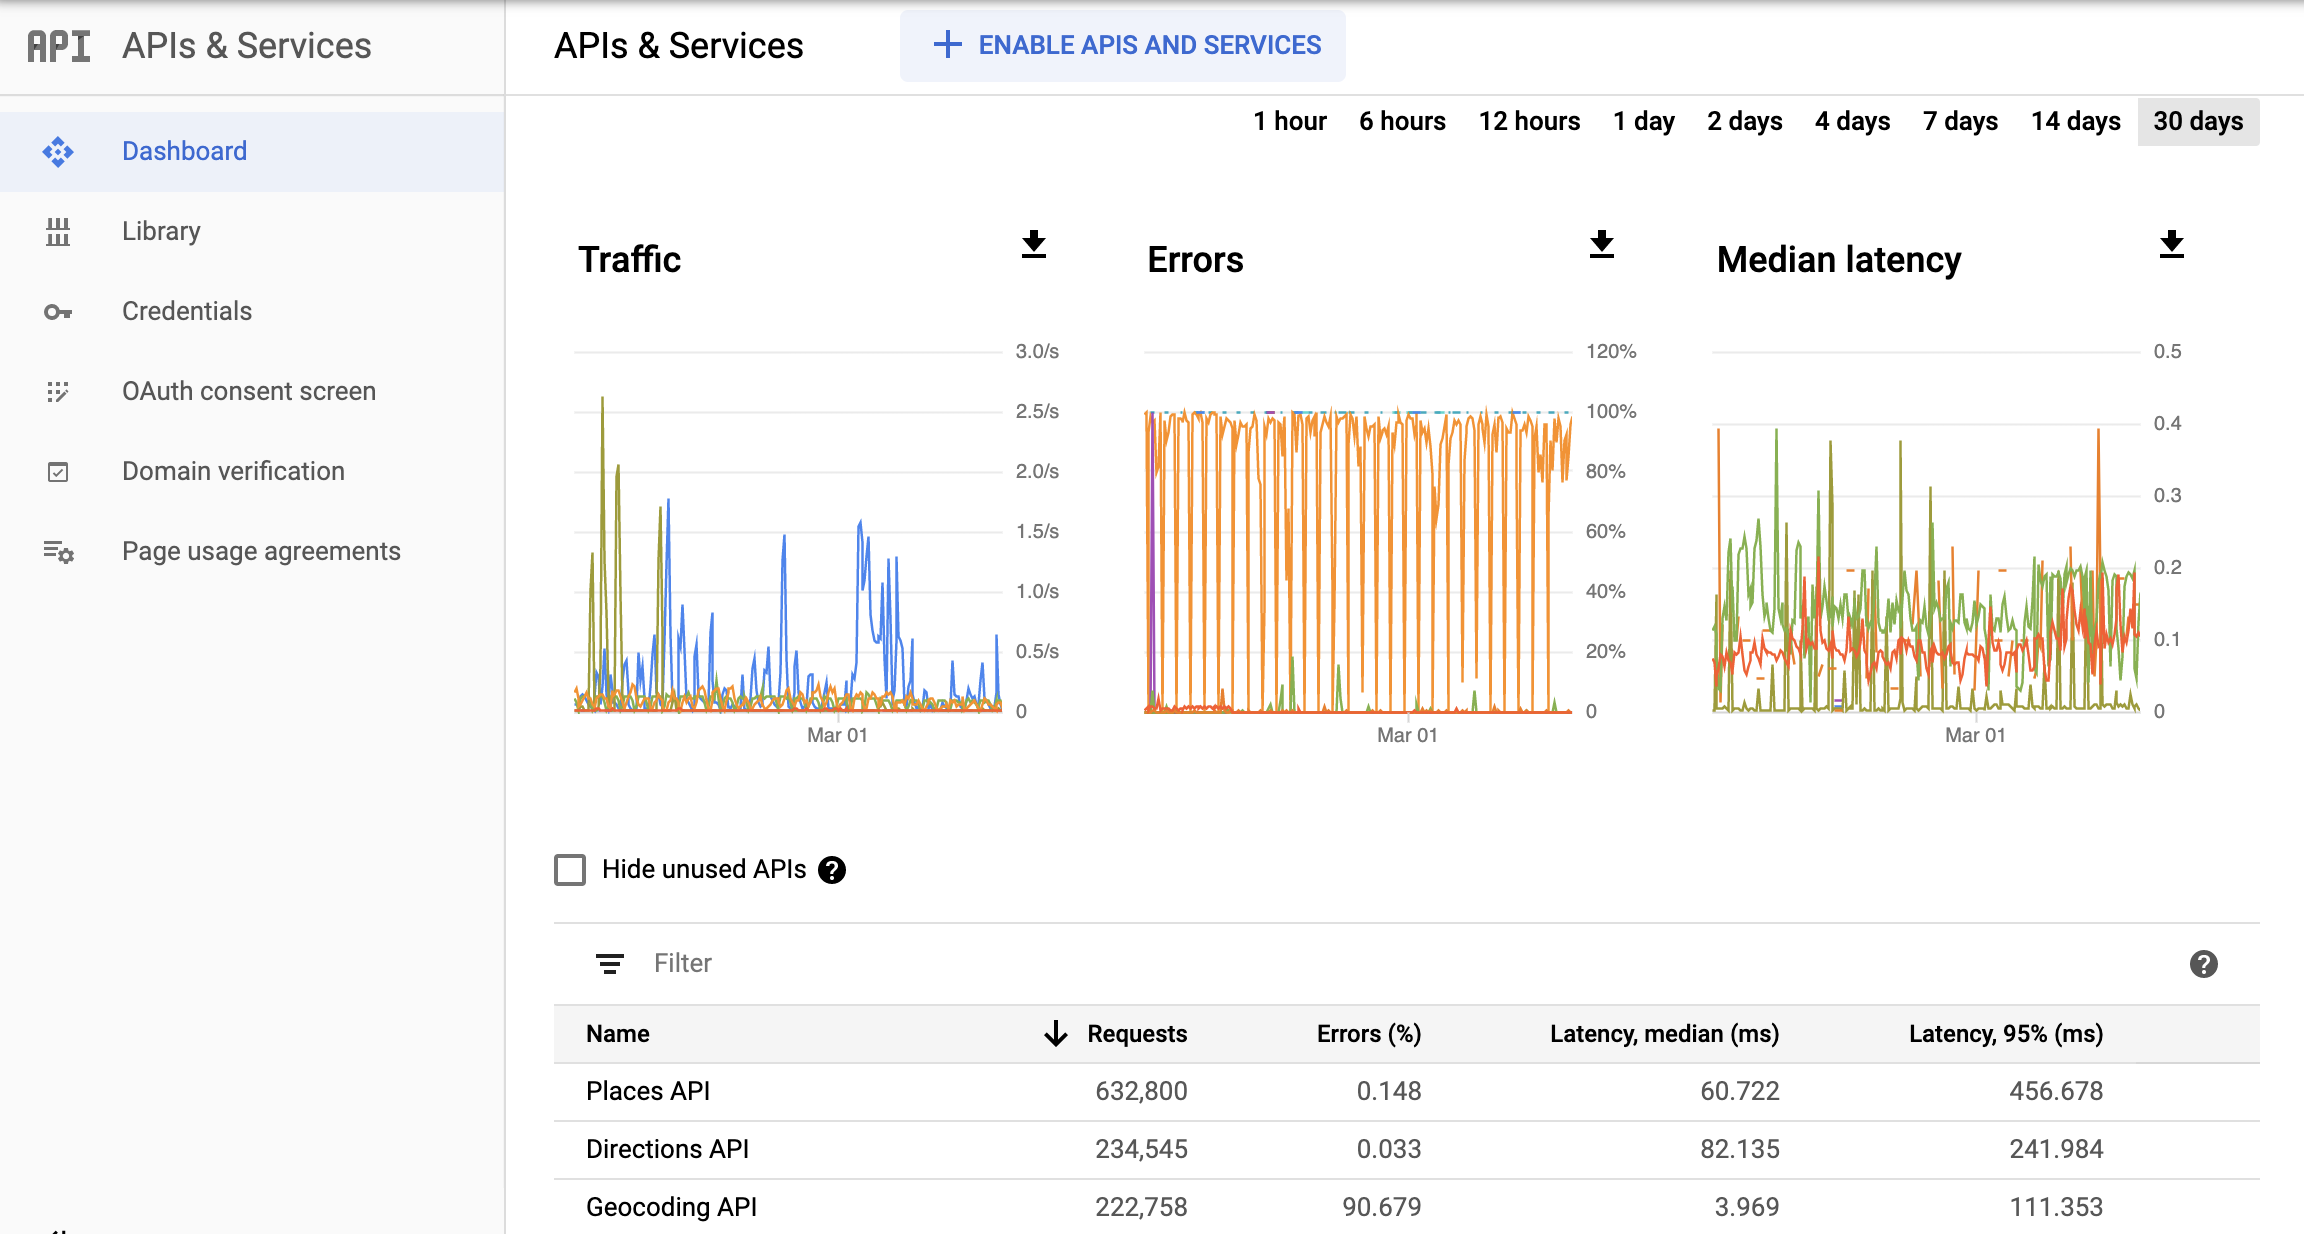
Cloud 控制台「API 和服務」報表會針對專案啟用的所有 API (包括 Google 地圖平台 API 和 SDK,以及所有其他 Google API 和服務) 提供用量指標。
這張圖片顯示「APIs & Services」(API 和服務) 報表。
配額
配額設定會限制專案可發出的 Google 地圖平台 API 要求數量。系統會按照以下三種方式來限制要求數量:
- 每天
- 每分鐘
- 每位使用者每分鐘 (如適用)
只有成功處理完成的要求以及導致伺服器錯誤的要求才會計入配額,未通過驗證的要求不會計入配額。
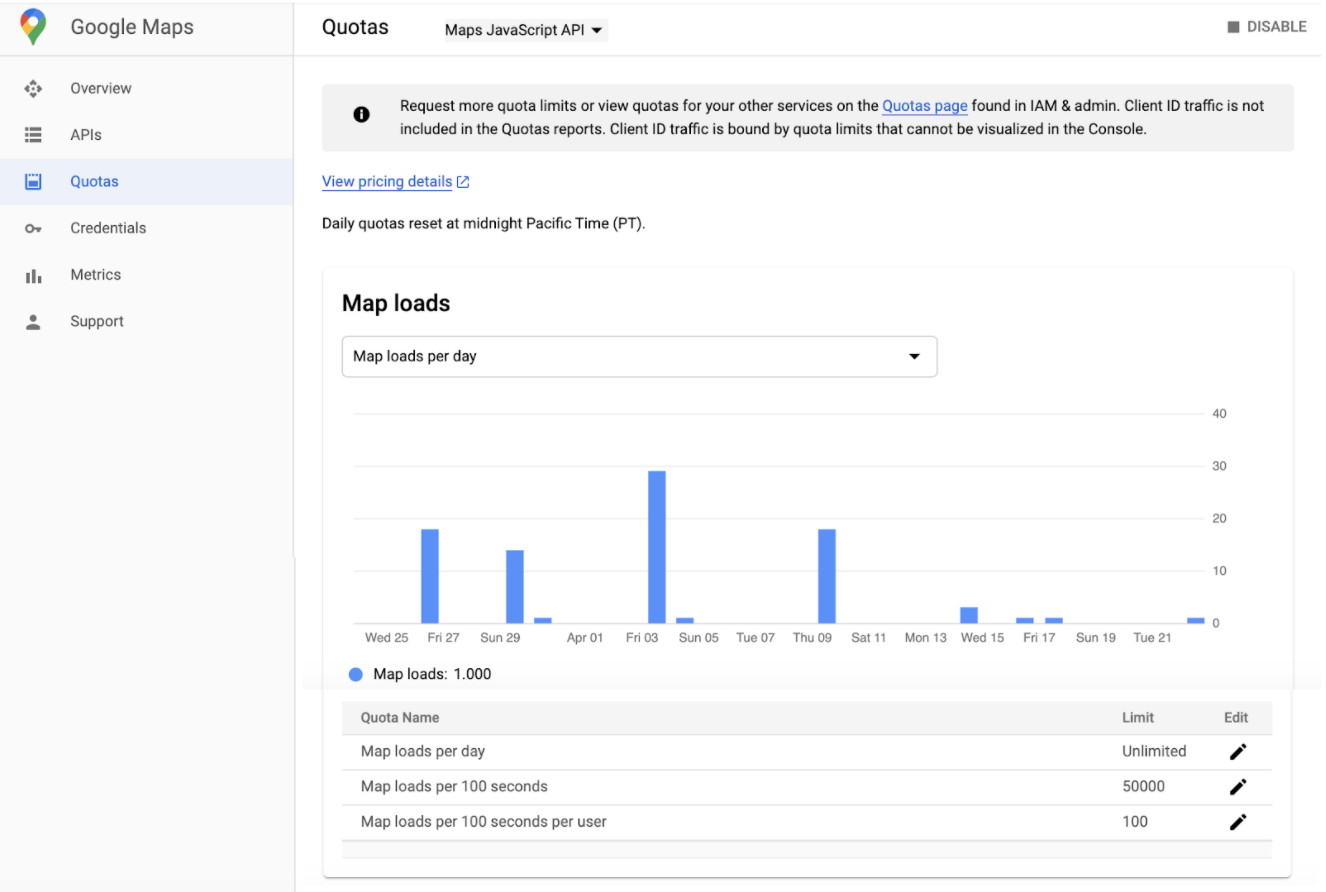
在 Cloud 控制台的「Quotas」(配額) 報表頁面中,配額用量會以圖表呈現。
帳單
Cloud 控制台的「帳單」報表會針對選取的專案顯示帳單和相關費用資訊。
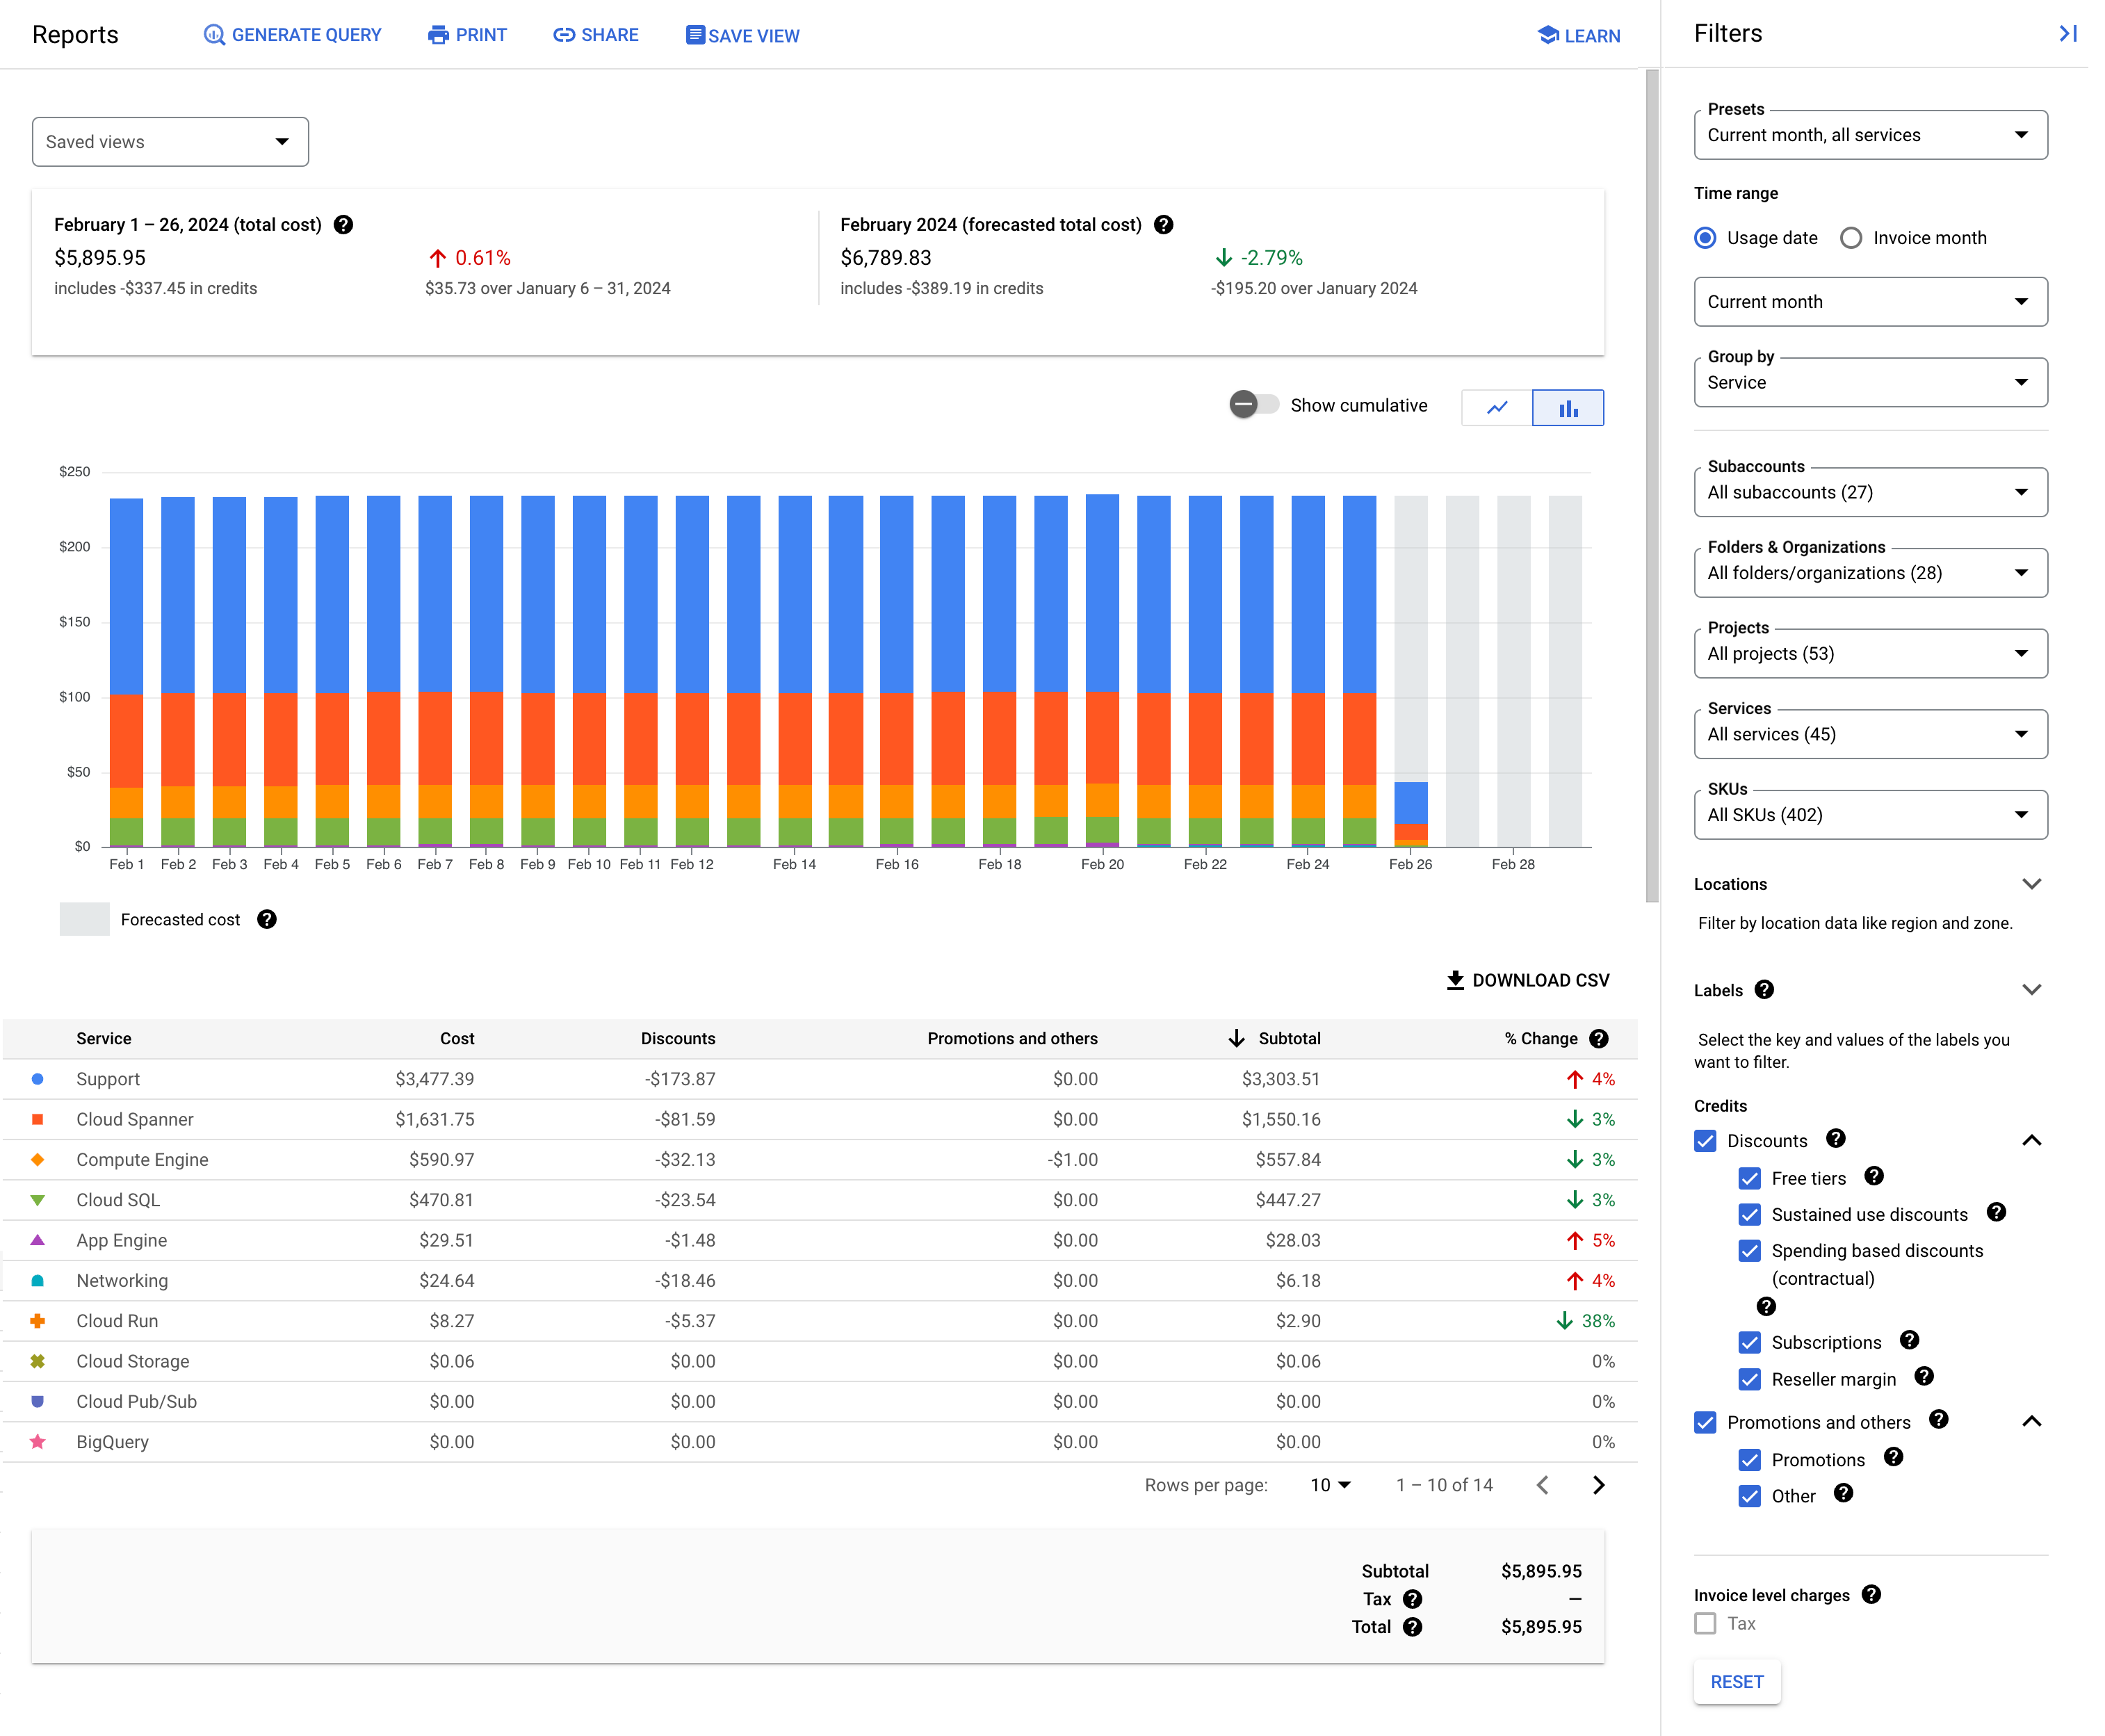
您可以透過 Cloud Billing 的「Reports」(報表) 頁面,針對 Cloud Billing 帳戶連結的所有專案,查看 Google Cloud 用量費用。如要查看重要的費用趨勢,您可以選取資料範圍、指定時間範圍、設定圖表篩選器,以及依專案、服務、SKU 或位置分組。
Cloud Billing 報表可協助您解答以下問題:
- 我這個月的 Google Cloud 支出趨勢為何?
- 上個月哪一項專案的費用最高?
- 根據歷來趨勢,未來的費用預計是多少?
- 各地區的支出是多少?
這張圖片顯示「Billing」(帳單) 報表。
監控
Cloud Monitoring 會收集您的服務和使用 Google Cloud 資源的計量結果。舉例來說,您可以監控指定時間間隔內的 API 呼叫或配額用量。
您不僅可以定義自訂指標和圖表,還可定義快訊。只要使用快訊,就能在服務效能未達到既定條件時發出通知。舉例來說,您可以透過電子郵件、簡訊、Cloud 控制台行動應用程式等方法發送通知。
指標
在 Cloud Monitoring 中:
- 「指標」是指計量項目,例如 API 呼叫次數、已使用用量配額百分比,或是虛擬機器的 CPU 使用率。
- 「時間序列」是一種資料結構,含有加上時間戳記的指標評估結果,以及這些評估結果的來源和意義相關資訊。
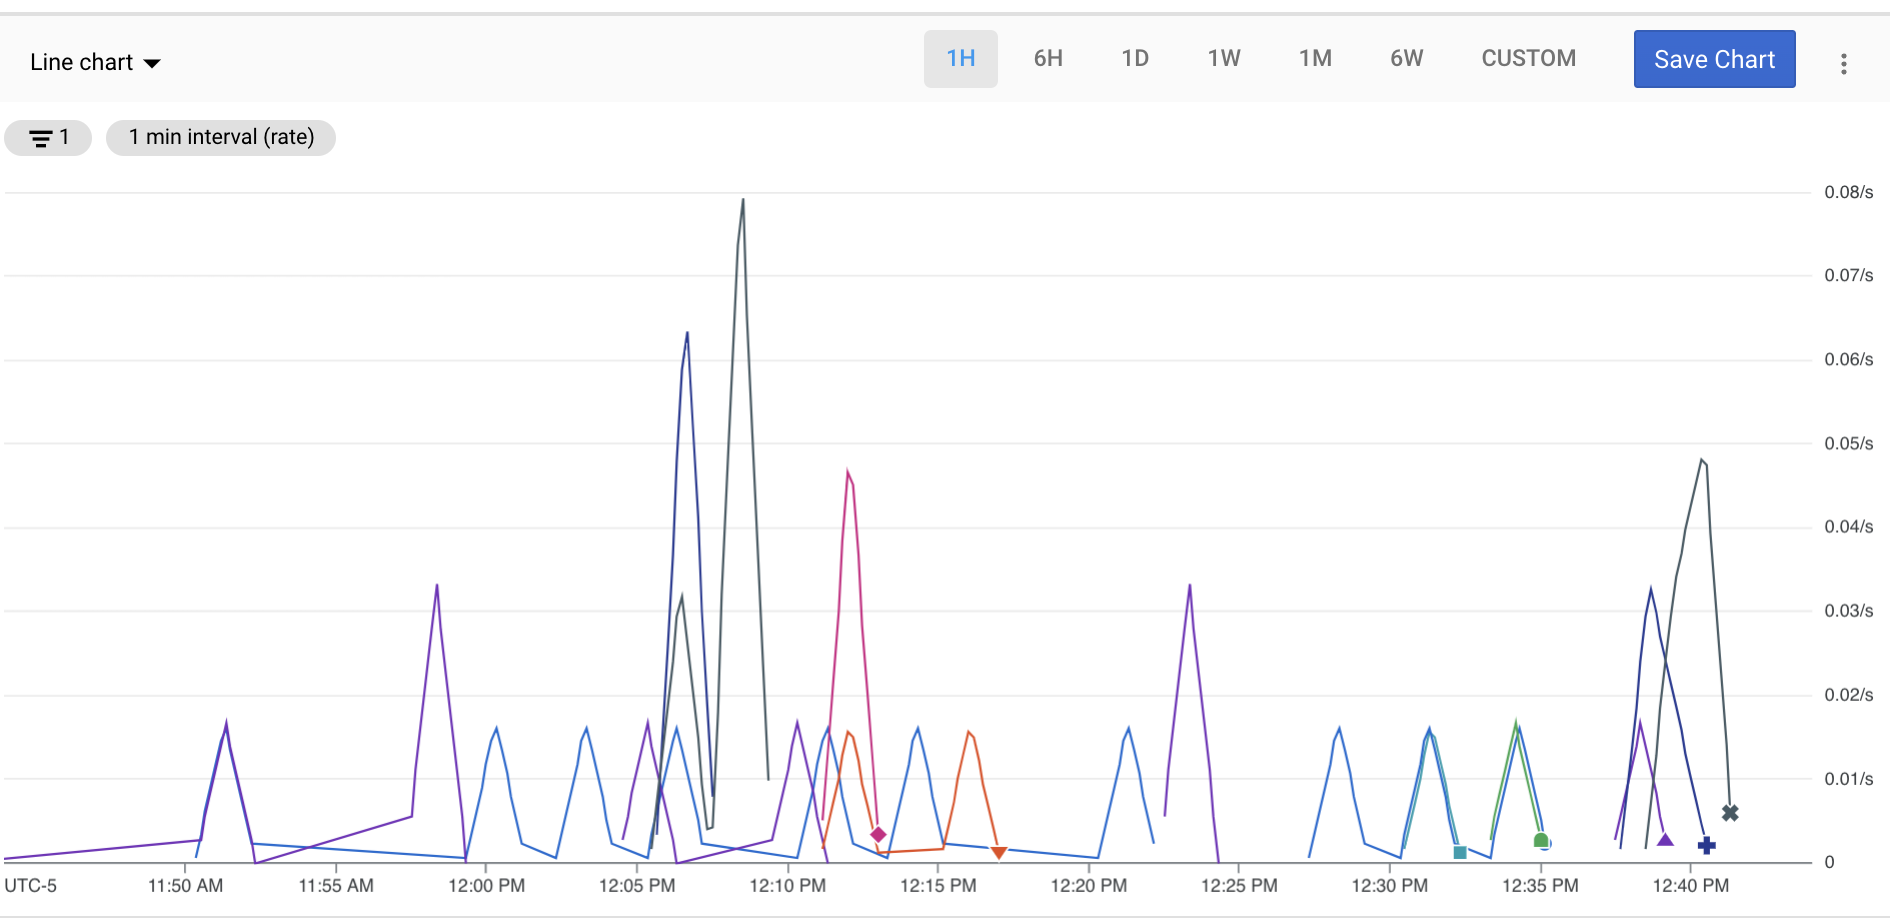
如要探索指標資料,請使用 Metrics Explorer 建立圖表。舉例來說,如要查看過去 1 小時內每分鐘的 API 要求數量,請使用 Metrics Explorer 建立圖表,顯示最新資料。
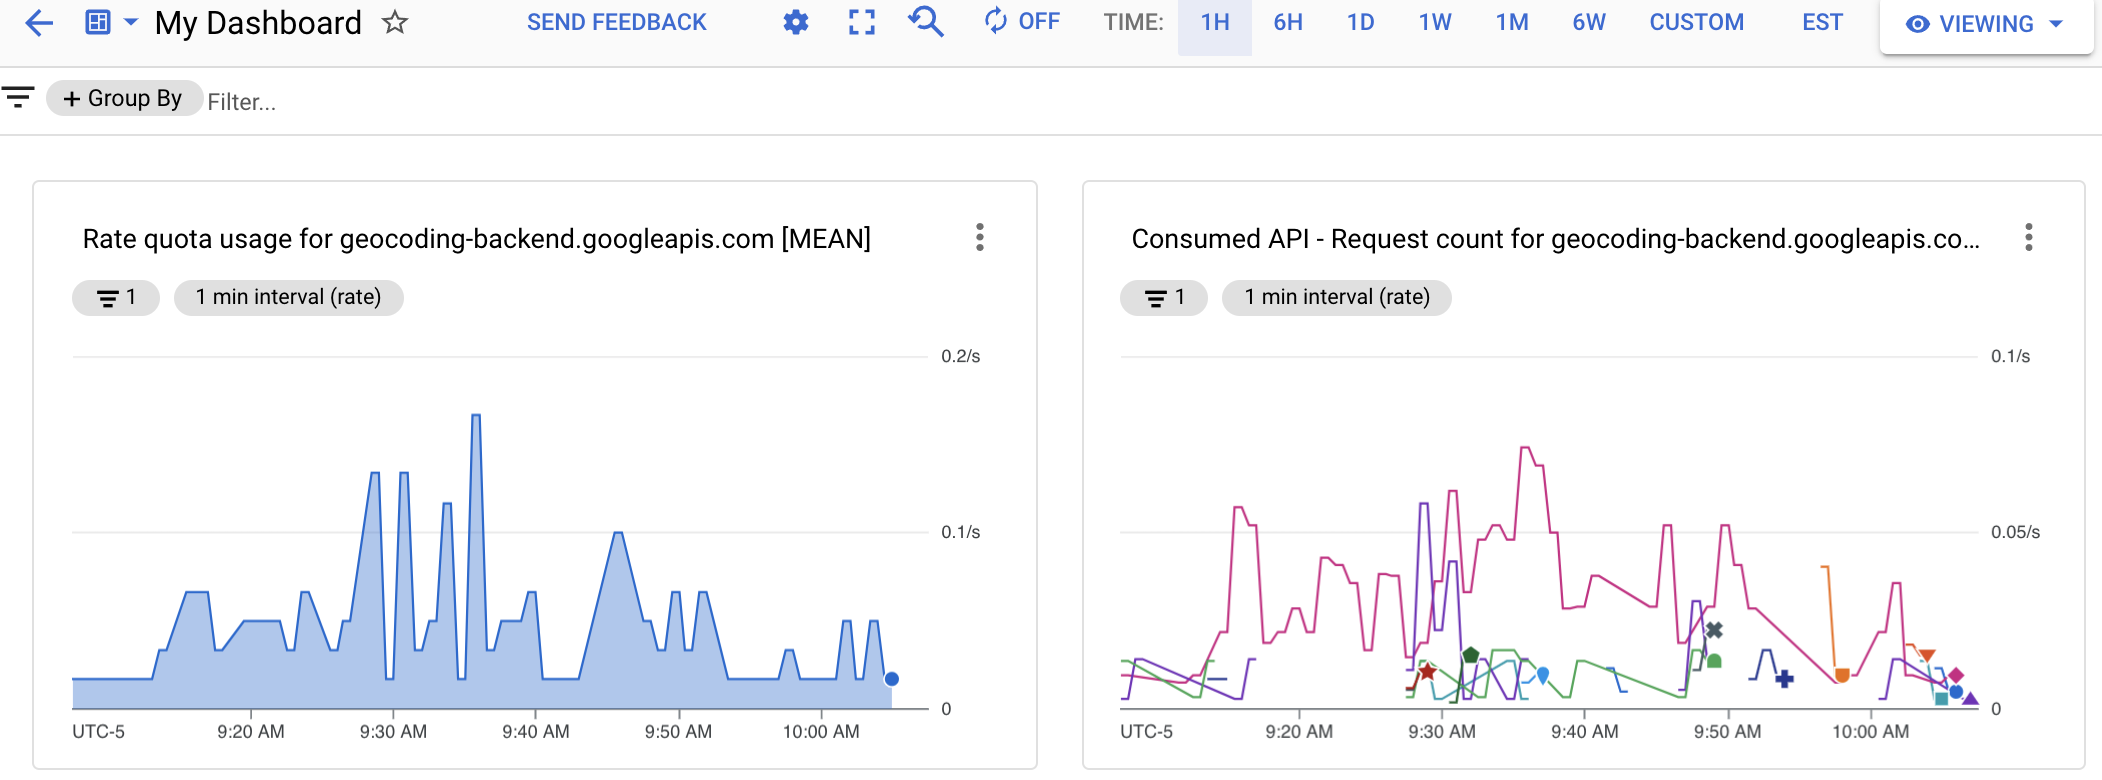
資訊主頁
您可以使用資訊主頁中一系列的圖表,查看及監控時間序列資料。如要建立自訂資訊主頁,您可以使用 Cloud 控制台或 Cloud Monitoring API。
下圖顯示自訂資訊主頁,其中有兩張圖表,左圖為配額圖表,右圖為 API 數量圖表。
快訊
如要在服務效能未達到既定條件時收到通知,請制定快訊政策。舉例來說,您可以制定快訊政策,在服務 HTTP 200 回應第 90 個百分位數的延遲時間超過 100 毫秒時,通知待命團隊。
快訊功能會及時提醒您雲端應用程式的問題,方便您迅速解決。
Cloud Monitoring 支援多種快訊,例如: