วิเคราะห์บันทึกด้วย BigQuery
จัดทุกอย่างให้เป็นระเบียบอยู่เสมอด้วยคอลเล็กชัน
บันทึกและจัดหมวดหมู่เนื้อหาตามค่ากำหนดของคุณ
BigQuery เป็นเครื่องมือที่มีประสิทธิภาพสำหรับการวิเคราะห์ คุณสามารถใช้เพื่อจัดเก็บบันทึกระยะยาวและทำการค้นหาที่คล้ายกับ SQL กับข้อมูลได้ หากต้องการใช้ BigQuery เพื่อการวิเคราะห์ คุณต้องกำหนดเส้นทางบันทึกไปยัง BigQuery อย่างชัดเจนตามที่อธิบายไว้ในส่วนถัดไป
กำหนดเส้นทางบันทึกไปยัง BigQuery
- ใน Logs Explorer ให้สร้างตัวกรองที่
แยกบันทึกของ Fleet Engine:
Fleetengine.googleapis.com/Fleet
- ในแผงผลลัพธ์ของคำค้นหา ให้คลิกเมนูการดำเนินการหรือการดำเนินการเพิ่มเติม
แล้วเลือกสร้าง Sink
- ระบุชื่อ Sink (เช่น FleetEngineLogsSink) คลิกถัดไป
- ในปลายทางของ Sink ให้เลือกชุดข้อมูล BigQuery
- ในเลือกชุดข้อมูล BigQuery ให้เลือกสร้างชุดข้อมูล BigQuery ใหม่
- ในกล่องโต้ตอบสร้างชุดข้อมูล ให้ป้อนรหัสชุดข้อมูล
- ปล่อยให้ส่วนอื่นๆ เหมือนเดิม แล้วคลิกสร้างชุดข้อมูล
- เลือกใช้ตารางที่แบ่งพาร์ติชันแล้ว คลิกถัดไป
- ปล่อยให้เลือกบันทึกเพื่อรวมไว้ในซิงก์และเลือกบันทึกที่จะกรองออกจาก
ซิงก์ตามเดิม
- คลิกสร้าง Sink
ตอนนี้บันทึกควรเริ่มป้อนข้อมูลในชุดข้อมูล BigQuery ซึ่งอาจใช้เวลาสักครู่ ดูส่งบันทึกเส้นทางไปยังปลายทางที่รองรับด้วย
เมื่อกำหนดเส้นทางข้อมูลบันทึกไปยัง BigQuery แล้ว ระบบจะสร้างตารางหลายตารางภายใต้ชุดข้อมูล FleetEngineLogs โดยอัตโนมัติ ซึ่งจะมีตารางสำหรับบันทึกแต่ละประเภทดังนี้
- CreateVehicle
- GetVehicle
- ListVehicles
- SearchVehicles
- UpdateVehicle
- CreateTrip
- GetTrip
- UpdateTrip
- ListTrips
ชื่อตารางใช้รูปแบบต่อไปนี้
project_id.data_set.log_name
ตัวอย่างเช่น หากโปรเจ็กต์ชื่อ test-project และชื่อชุดข้อมูลคือ FleetEngineLogs ตาราง CreateTrip
จะมีชื่อดังนี้
test-project.FleetEngineLogs.fleetengine_googleapis_com_create_trip
ตัวอย่างการค้นหาสำหรับ BigQuery
ตัวอย่างการค้นหาต่อไปนี้แสดงวิธีค้นหารายการบันทึกต่างๆ
ใน BigQuery
จำนวนบันทึก CreateTrips ที่จัดกลุ่มตามชั่วโมง
SELECT TIMESTAMP_TRUNC(timestamp, HOUR) as hour,
count(*) as num_trips_created
FROM
`ProjectId.FleetEngineLogs.fleetengine_googleapis_com_create_trip`
GROUP BY hour
ORDER by hour
จำนวนป้ายจอดรถต่อยานพาหนะต่อชั่วโมง
SELECT
jsonpayload_v1_updatevehiclelog.request.vehicleid AS vehicle,
TIMESTAMP_TRUNC(timestamp, HOUR) AS hour,
COUNT(*) AS num_stops
FROM
`ProjectId.FleetEngineLogs.fleetengine_googleapis_com_update__vehicle`
WHERE
ARRAY_LENGTH(jsonpayload_v1_updatevehiclelog.request.vehicle.remainingvehiclejourneysegments) > 0
AND jsonpayload_v1_updatevehiclelog.request.vehicle.remainingvehiclejourneysegments[
OFFSET
(0)].stop.state = 'VEHICLE_STOP_STATE_LOG_ARRIVED'
GROUP BY
1,
2
ORDER BY
2
ตัวอย่างเช่น คำค้นหานี้อาจบอกคุณได้ว่าในช่วงชั่วโมงที่ผ่านมา
- รถ ก. แวะจอด 10 ครั้งในชั่วโมงที่ 12 และ 8 ครั้งในชั่วโมงที่ 13
- รถ B แวะจอด 5 ครั้งในชั่วโมงที่ 11 และ 7 ครั้งในชั่วโมงที่ 12
- รถคันที่ 3 แวะจอด 12 ครั้งในชั่วโมงที่ 13 และ 9 ครั้งในชั่วโมงที่ 14
ดูดูบันทึกที่กำหนดเส้นทางไปยัง BigQuery ด้วย
ผสานรวม BigQuery กับ Looker Studio
คุณสามารถผสานรวม BigQuery กับเครื่องมือ Business Intelligence เพื่อสร้างแดชบอร์ด
สําหรับการวิเคราะห์ธุรกิจ ดู Looker Studio
ตัวอย่างต่อไปนี้แสดงวิธีสร้างแดชบอร์ด Looker Studio เพื่อ
แสดงภาพการเดินทางและการเคลื่อนที่ของยานพาหนะบนแผนที่
- เปิดแดชบอร์ด Looker Studio ใหม่ แล้วเลือก
BigQuery เป็นการเชื่อมต่อข้อมูล
- เลือกคําค้นหาที่กําหนดเอง แล้วป้อนหรือเลือกโปรเจ็กต์ Cloud ที่ควรเรียกเก็บเงินด้วยตนเอง
- ป้อนคำค้นหาต่อไปนี้อย่างใดอย่างหนึ่งในช่องค้นหา
ตัวอย่างการค้นหาการเดินทางตามคำขอ
SELECT
timestamp,
labels.vehicle_id,
jsonpayload_v1_updatevehiclelog.response.lastlocation.location.latitude AS lat,
jsonpayload_v1_updatevehiclelog.response.lastlocation.location.longitude AS lng
FROM
`ProjectId.TableName.fleetengine_googleapis_com_update_vehicle`
ตัวอย่างการค้นหาของ Scheduled Tasks
SELECT
labels.delivery_vehicle_id,
jsonpayload_v1_updatedeliveryvehiclelog.response.lastlocation.rawlocation.longitude as lat, jsonpayload_v1_updatedeliveryvehiclelog.response.lastlocation.rawlocation.latitude as lng
FROM `ProjectID.TableName.fleetengine_googleapis_com_update_delivery_vehicle`
- เลือกประเภทแผนภูมิเป็นแผนที่ฟอง แล้วเลือกช่องสถานที่ตั้ง
- เลือกเพิ่มช่อง
- ตั้งชื่อช่องและเพิ่มสูตร
CONCAT(lat, ",", lng)
- ตั้งค่าประเภทเป็น Geo->Latitude, Longitude
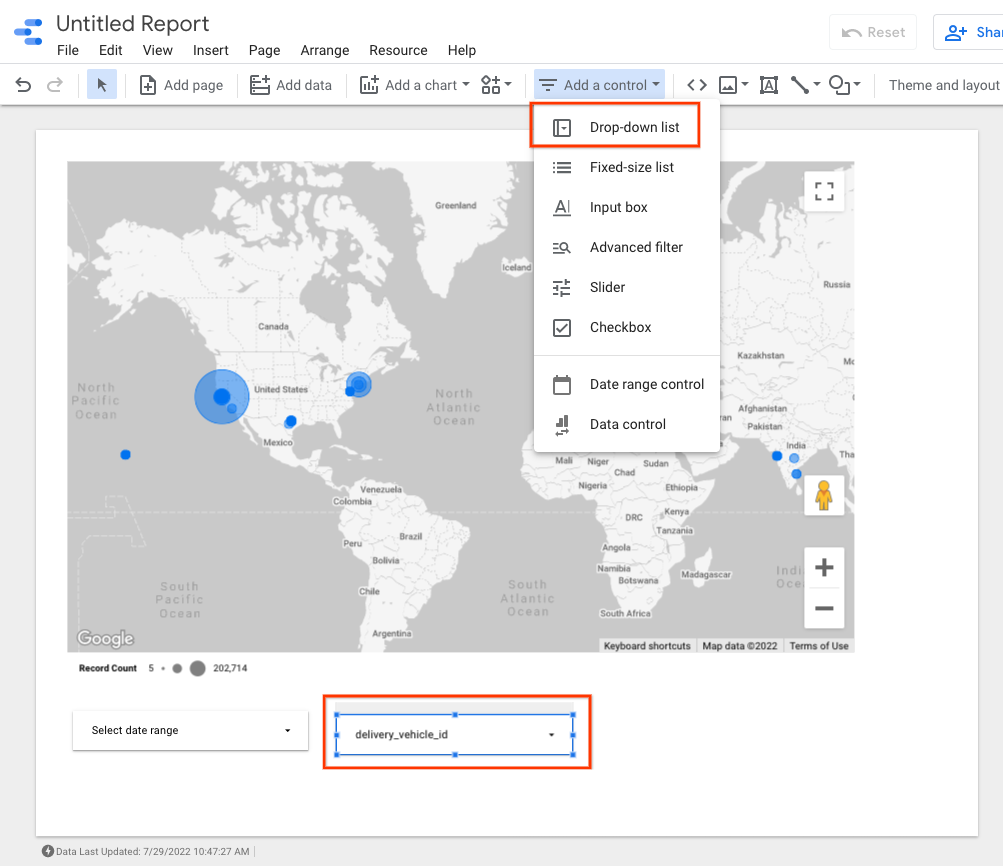
- คุณเพิ่มตัวควบคุมลงในแดชบอร์ดเพื่อกรองข้อมูลได้ เช่น เลือกตัวกรองช่วงวันที่
- แก้ไขช่องช่วงวันที่เพื่อเลือกช่วงวันที่เริ่มต้น
- คุณสามารถเพิ่มตัวควบคุมรายการแบบเลื่อนลงเพิ่มเติมสำหรับ
vehicle_id
ได้
การควบคุมเหล่านี้ช่วยให้คุณเห็นภาพการเคลื่อนไหวของยานพาหนะหรือ
การเคลื่อนไหวภายในทริป
ตัวอย่างเอาต์พุตของ Looker Studio

ขั้นตอนถัดไป
หากต้องการปฏิบัติตามนโยบายการเก็บรักษาข้อมูล โปรดดูจำกัดการเก็บรักษาบันทึก
เนื้อหาของหน้าเว็บนี้ได้รับอนุญาตภายใต้ใบอนุญาตที่ต้องระบุที่มาของครีเอทีฟคอมมอนส์ 4.0 และตัวอย่างโค้ดได้รับอนุญาตภายใต้ใบอนุญาต Apache 2.0 เว้นแต่จะระบุไว้เป็นอย่างอื่น โปรดดูรายละเอียดที่นโยบายเว็บไซต์ Google Developers Java เป็นเครื่องหมายการค้าจดทะเบียนของ Oracle และ/หรือบริษัทในเครือ
อัปเดตล่าสุด 2025-09-05 UTC
[[["เข้าใจง่าย","easyToUnderstand","thumb-up"],["แก้ปัญหาของฉันได้","solvedMyProblem","thumb-up"],["อื่นๆ","otherUp","thumb-up"]],[["ไม่มีข้อมูลที่ฉันต้องการ","missingTheInformationINeed","thumb-down"],["ซับซ้อนเกินไป/มีหลายขั้นตอนมากเกินไป","tooComplicatedTooManySteps","thumb-down"],["ล้าสมัย","outOfDate","thumb-down"],["ปัญหาเกี่ยวกับการแปล","translationIssue","thumb-down"],["ตัวอย่าง/ปัญหาเกี่ยวกับโค้ด","samplesCodeIssue","thumb-down"],["อื่นๆ","otherDown","thumb-down"]],["อัปเดตล่าสุด 2025-09-05 UTC"],[[["\u003cp\u003eBigQuery enables analysis of Fleet Engine logs via SQL-like queries after routing logs to a BigQuery dataset.\u003c/p\u003e\n"],["\u003cp\u003eRouting logs to BigQuery involves creating a sink in the Logs Explorer and selecting a BigQuery dataset as the destination.\u003c/p\u003e\n"],["\u003cp\u003eBigQuery automatically populates tables for each Fleet Engine log type under the specified dataset.\u003c/p\u003e\n"],["\u003cp\u003eExample queries demonstrate how to analyze trip creation, vehicle stops, and other data points within BigQuery.\u003c/p\u003e\n"],["\u003cp\u003eBigQuery integrates with Looker Studio for creating dashboards and visualizing data, such as vehicle movement on a map.\u003c/p\u003e\n"]]],[],null,["BigQuery is a powerful tool for performing analytics. You can use it to store\nlonger-term logs and to perform SQL-like queries against the data. To use\nBigQuery for analysis, you must explicitly route your logs to BigQuery, as\ndescribed in the next section.\n\nRoute logs to BigQuery\n\n1. In the [Logs Explorer](https://cloud.google.com/logging/docs/view/logs-explorer-interface), create a filter that isolates the Fleet Engine logs: `Fleetengine.googleapis.com/Fleet`.\n2. In the **Query Results pane** , click the **Actions** or **More Actions** menu and choose **Create Sink**.\n3. Specify a sink name (for example, *FleetEngineLogsSink* ). Click **Next**.\n4. In the **Sink Destination** , select **BigQuery dataset**.\n5. In **Select BigQuery dataset** , select **Create new BigQuery dataset**.\n6. In the **Create dataset** dialog, enter a **Dataset ID**.\n7. Leave everything else as is and click **Create dataset**.\n8. Check **Use partitioned tables** . Click **Next**.\n9. Leave **Choose logs to include in sink** and **Choose logs to filter out of\n sink** as they are.\n10. Click **Create Sink**.\n\nYour logs should now begin to populate the BigQuery dataset, which can take a\nshort while. See also [Route logs to supported destinations](https://cloud.google.com/logging/docs/export/configure_export_v2).\n\nOnce you are routing log data to BigQuery, several tables under the\n*FleetEngineLogs* dataset are automatically populated, one for each log type:\n\n- CreateVehicle\n- GetVehicle\n- ListVehicles\n- SearchVehicles\n- UpdateVehicle\n- CreateTrip\n- GetTrip\n- UpdateTrip\n- ListTrips\n\nThe table names use the following pattern: \n\n project_id.data_set.log_name\n\nFor example, if the project is called *test-project* and the dataset name is\n*FleetEngineLogs* , the `CreateTrip` table has the following name: \n\n test-project.FleetEngineLogs.fleetengine_googleapis_com_create_trip\n\nExample queries for BigQuery\n\nThe following example queries show how you can search for different log entries\nin BigQuery.\n\nNumber of CreateTrips logs grouped by hour \n\n SELECT TIMESTAMP_TRUNC(timestamp, HOUR) as hour,\n count(*) as num_trips_created\n FROM\n `ProjectId.FleetEngineLogs.fleetengine_googleapis_com_create_trip`\n GROUP BY hour\n ORDER by hour\n\nNumber of stops per vehicle per hour \n\n SELECT\n jsonpayload_v1_updatevehiclelog.request.vehicleid AS vehicle,\n TIMESTAMP_TRUNC(timestamp, HOUR) AS hour,\n COUNT(*) AS num_stops\n FROM\n `ProjectId.FleetEngineLogs.fleetengine_googleapis_com_update__vehicle`\n WHERE\n ARRAY_LENGTH(jsonpayload_v1_updatevehiclelog.request.vehicle.remainingvehiclejourneysegments) \u003e 0\n AND jsonpayload_v1_updatevehiclelog.request.vehicle.remainingvehiclejourneysegments[\n OFFSET\n (0)].stop.state = 'VEHICLE_STOP_STATE_LOG_ARRIVED'\n GROUP BY\n 1,\n 2\n ORDER BY\n 2\n\nFor example, this query could tell you that in the last hour:\n\n- Vehicle A completed 10 stops in hour 12 and 8 stops in hour 13.\n- Vehicle B completed 5 stops in hour 11 and 7 stops in hour 12.\n- Vehicle C completed 12 stops in hour 13 and 9 stops in hour 14.\n\nSee also [View logs routed to BigQuery](https://cloud.google.com/logging/docs/export/bigquery).\n\nIntegrate BigQuery with Looker Studio\n\nBigQuery can be integrated with business intelligence tools to create dashboards\nfor business analytics. See [Looker Studio](https://lookerstudio.google.com).\n\nThe following example shows how to build a Looker Studio dashboard for\nvisualizing trips and vehicle movements on a map.\n\n1. Launch a new [Looker Studio](https://lookerstudio.google.com) dashboard and select **BigQuery** as the data connection.\n2. Select **Custom Query** and manually enter or select the Cloud Project to which it should be billed.\n3. Enter one of the following queries into the query box.\n\nOn-demand trips example query \n\n SELECT\n timestamp,\n labels.vehicle_id,\n jsonpayload_v1_updatevehiclelog.response.lastlocation.location.latitude AS lat,\n jsonpayload_v1_updatevehiclelog.response.lastlocation.location.longitude AS lng\n FROM\n `ProjectId.TableName.fleetengine_googleapis_com_update_vehicle`\n\nScheduled Tasks example query \n\n SELECT\n labels.delivery_vehicle_id,\n jsonpayload_v1_updatedeliveryvehiclelog.response.lastlocation.rawlocation.longitude as lat, jsonpayload_v1_updatedeliveryvehiclelog.response.lastlocation.rawlocation.latitude as lng\n FROM `ProjectID.TableName.fleetengine_googleapis_com_update_delivery_vehicle`\n\n1. Select **Chart Type as Bubble Map** , and then select the **location** field.\n2. Select **Add a Field**.\n3. Name the field and add the following formula: `CONCAT(lat, \",\", lng)`.\n4. Set the type to **Geo-\\\u003eLatitude, Longitude**.\n5. You can add controls to the dashboard to filter data. For example, select the **Date-range** filter.\n6. Edit the date range box to select a default date range.\n7. You can add additional *drop-down list* controls for `vehicle_id`. With these controls, you can visualize the movement of the vehicle or the movement within a trip.\n\nLooker Studio example output:\n\nWhat's next\n\nTo comply with data retention policies, see [Restrict log\nretention](/maps/documentation/mobility/operations/cloud-logging/reduce-cost)."]]