Gaya visual berbasis data untuk set data memungkinkan Anda mengupload set data geospasial Anda sendiri, menerapkan gaya visual kustom ke fitur datanya, dan menampilkan fitur data tersebut di peta. Dengan gaya visual berbasis data untuk set data, Anda dapat membuat visualisasi data berdasarkan geometri titik, polyline, dan poligon, serta membuat fitur data merespons peristiwa klik. Gaya visual berbasis data untuk set data hanya didukung pada peta vektor (diperlukan ID peta).
Tambahkan data kustom menggunakan Konsol Google Cloud atau Google Cloud Shell. Setiap set data memiliki ID unik, yang dapat Anda kaitkan dengan gaya peta.
Format data berikut ini didukung:
Untuk menerapkan gaya visual pada set data, Anda harus mengaitkan gaya peta dengan ID peta, yang juga mengaitkan set data dengan ID peta. Di aplikasi, developer dapat mereferensikan
ID peta tersebut, serta gaya peta dan data geospasial yang terkait dengannya. Tidak ada kontrol akses tambahan yang diterapkan pada data geospasial, sehingga data geospasial secara efektif tersedia secara publik bagi siapa saja yang memiliki aplikasi tersebut.
Menata gaya fitur data
Setelah data kustom diupload dan dikaitkan dengan gaya peta dan ID peta, Anda dapat menata gaya fitur data untuk tampilan visual, dan membuat fitur merespons peristiwa klik.
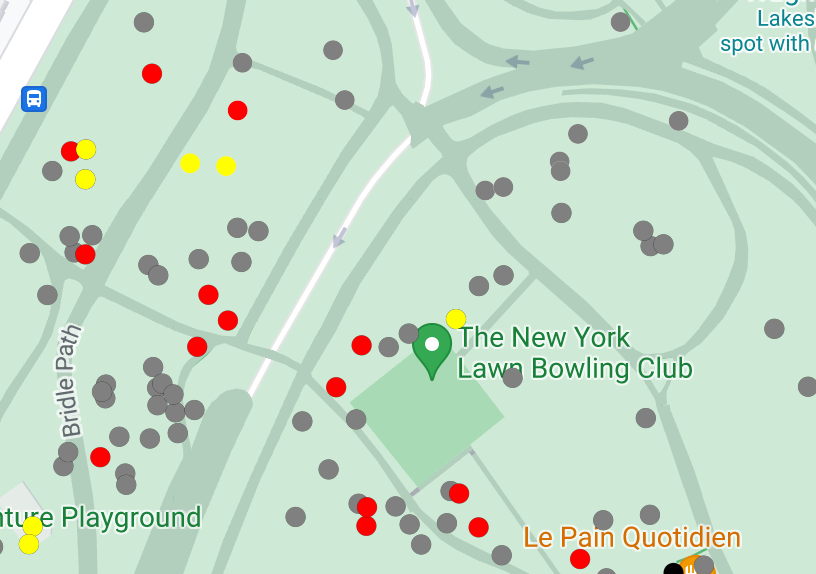
Tata gaya data titik untuk menampilkan lokasi tertentu pada peta.
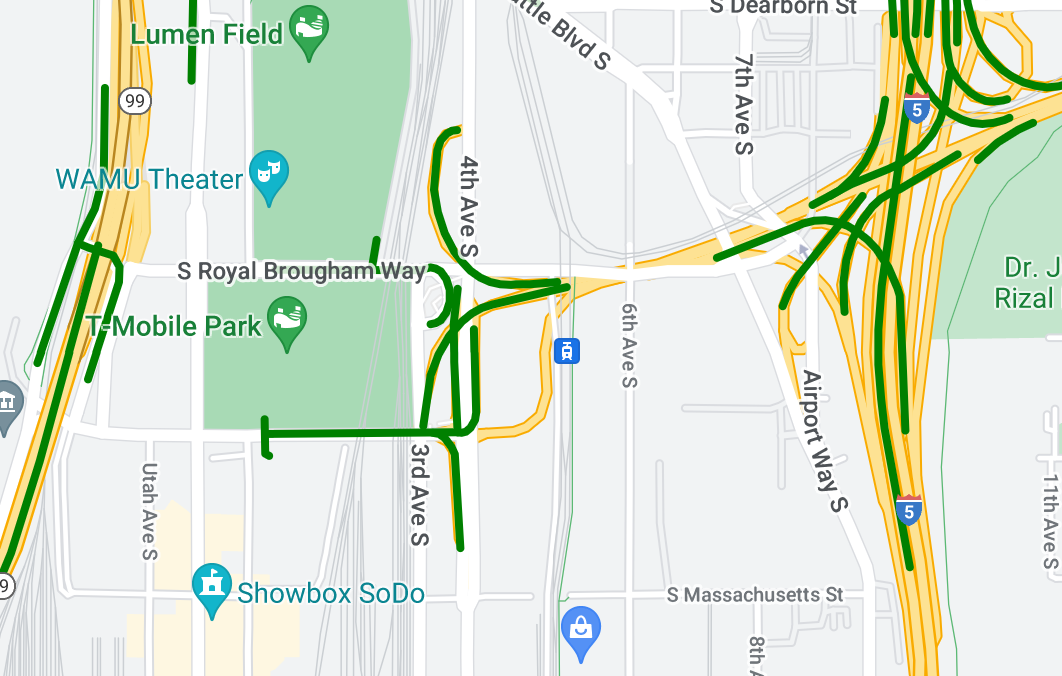
Tata gaya data polyline untuk menyoroti fitur geografis.
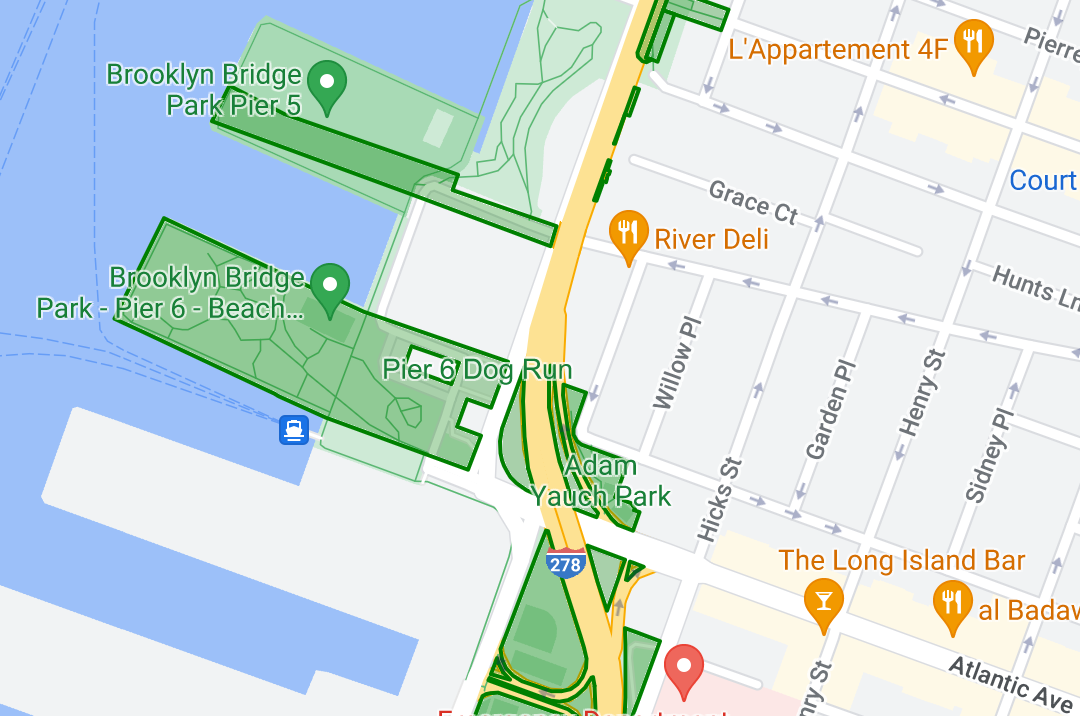
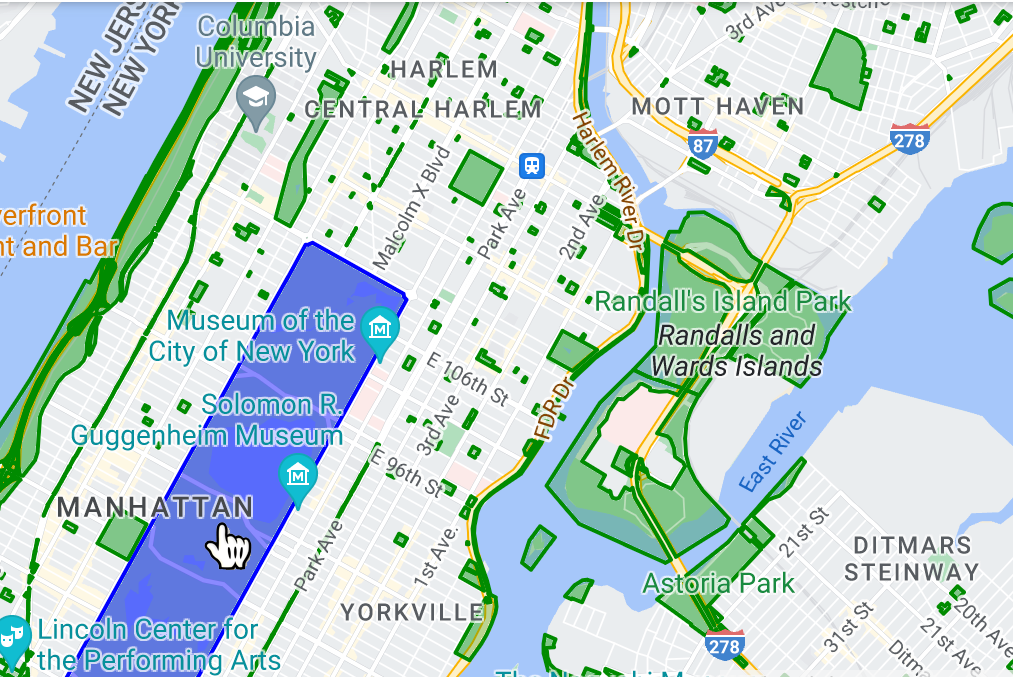
Tata gaya data poligon untuk menyoroti area geografis.
Buat fitur data merespons peristiwa klik dengan menambahkan pemroses peristiwa.
Performa saat merender sejumlah besar fitur data
Saat merender sejumlah besar fitur data, Anda mungkin melihat masalah performa di aplikasi. Misalnya, Anda mungkin melihat masalah performa atau stabilitas aplikasi saat melakukan zoom atau rotasi.
[[["Mudah dipahami","easyToUnderstand","thumb-up"],["Memecahkan masalah saya","solvedMyProblem","thumb-up"],["Lainnya","otherUp","thumb-up"]],[["Informasi yang saya butuhkan tidak ada","missingTheInformationINeed","thumb-down"],["Terlalu rumit/langkahnya terlalu banyak","tooComplicatedTooManySteps","thumb-down"],["Sudah usang","outOfDate","thumb-down"],["Masalah terjemahan","translationIssue","thumb-down"],["Masalah kode / contoh","samplesCodeIssue","thumb-down"],["Lainnya","otherDown","thumb-down"]],["Terakhir diperbarui pada 2025-08-31 UTC."],[[["\u003cp\u003eData-driven styling allows you to upload, style, and display custom geospatial datasets (GeoJSON, CSV, KML) on vector maps using Google Maps Platform.\u003c/p\u003e\n"],["\u003cp\u003eDatasets are associated with map styles and IDs, enabling data visualization and interactivity based on point, polyline, and polygon geometries.\u003c/p\u003e\n"],["\u003cp\u003ePublic datasets, when linked to a map ID, become accessible to anyone with the app using that ID, requiring awareness regarding data sensitivity.\u003c/p\u003e\n"],["\u003cp\u003eData features can be styled for visual impact and interactivity, such as highlighting locations, geographical features, areas, and responding to click events.\u003c/p\u003e\n"],["\u003cp\u003eRendering a large number of data features might impact app performance, potentially causing lag or stability issues during zoom or rotate operations.\u003c/p\u003e\n"]]],[],null,["Select platform: [Android](/maps/documentation/android-sdk/dds-datasets/overview \"View this page for the Android platform docs.\") [iOS](/maps/documentation/ios-sdk/dds-datasets/overview \"View this page for the iOS platform docs.\") [JavaScript](/maps/documentation/javascript/dds-datasets/overview \"View this page for the JavaScript platform docs.\")\n\n\u003cbr /\u003e\n\nData-driven styling for datasets lets you upload your own geospatial datasets,\napply custom styling to their data features, and display those data features on\nmaps. With data-driven styling for datasets, you can create data visualizations\nbased on point, polyline, and polygon geometries, and make data features respond\nto click events. Data-driven styling for datasets is supported on vector maps\nonly (a map ID is required).\n\n[Get started with data-driven styling for datasets](/maps/documentation/android-sdk/dds-datasets/start)\n\nAdd custom geospatial datasets\n\nAdd your custom data using Google Cloud Console or Google Cloud\nShell. Each dataset has a unique ID, which you can associate with a map style.\nThe following data formats are supported:\n\n- GeoJSON\n- Comma-separated (CSV)\n- KML\n\nFor details about dataset requirements and limitations, see\n[Create and manage a dataset](/maps/documentation/android-sdk/dds-datasets/create-dataset#dataset-prerequisites)\n\nAbout public datasets\n\nIn order to style a dataset you must associate a map style with a map ID, which\nalso associates the dataset to the map ID. In an app, developers can reference\nthat map ID, and any map style and geospatial data associated with it. No\nadditional access control is applied to the geospatial data, making the\ngeospatial data effectively publicly available to anyone with the app.\n\nStyle data features\n\nOnce your custom data has been uploaded and associated to a map\nstyle and map ID, you can style data features for visual impact, and make\nfeatures respond to click events.\n\nStyle point data to show specific locations on the map.\n\nStyle polyline data to highlight geographical features.\n\nStyle polygon data to highlight geographical areas.\n\nMake data features respond to click events by adding an event\nlistener.\n\nPerformance when rendering a large number of data features\n\nWhen rendering a large number of data features, you might notice performance\nissues in your app. For example, you might notice a performance lag or stability\nissues with the app during a zoom or rotate."]]