Page Summary
-
IrrMapper is an annual classification of irrigation status in the 11 Western United States at 30m resolution, covering years 1986 to the present.
-
The dataset uses a Random Forest algorithm to classify land as either irrigated or non-irrigated, based on extensive training data.
-
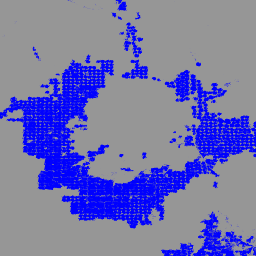
Irrigated areas in the dataset have a pixel value of 1, while other areas are masked out.
- Dataset Availability
- 1986-01-01T00:00:00Z–2025-01-01T00:00:00Z
- Dataset Producer
- University of Montana / Montana Climate Office
- Tags
Description
IrrMapper is an annual classification of irrigation status in the 11 Western United States made at Landsat scale (i.e., 30 m) using the Random Forest algorithm, covering years 1986 - present.
While the IrrMapper paper describes classification of four classes (i.e., irrigated, dryland, uncultivated, wetland), the dataset is converted to a binary classification of irrigated and non-irrigated.
'Irrigated' refers to the detection of any irrigation during the year. The IrrMapper random forest model was trained using an extensive geospatial database of land cover from each of four irrigated- and non-irrigated classes, including over 50,000 human-verified irrigated fields, 38,000 dryland fields, and over 500,000 square kilometers of uncultivated lands.
For version 1.2, the original training data was greatly expanded, a RF model built for each state, and a more thorough validation and uncertainty analysis undertaken. See the supplement to our paper on the impacts of irrigation on streamflow.
Bands
Bands
Pixel size: 30 meters (all bands)
| Name | Pixel Size | Description |
|---|---|---|
classification |
30 meters | Irrigated pixels have the value of 1, the other pixels are masked out. |
Terms of Use
Terms of Use
Citations
Ketchum, D.; Jencso, K.; Maneta, M.P.; Melton, F.; Jones, M.O.; Huntington, J. IrrMapper: A Machine Learning Approach for High Resolution Mapping of Irrigated Agriculture Across the Western U.S., Remote Sens. 2020, 12, 2328. doi:10.3390/rs12142328
Ketchum, D., Hoylman, Z.H., Huntington, J. et al. Irrigation intensification impacts sustainability of streamflow in the Western United States. Commun Earth Environ 4, 479 (2023). doi:10.1038/s43247-023-01152-2
Explore with Earth Engine
Code Editor (JavaScript)
var dataset = ee.ImageCollection('UMT/Climate/IrrMapper_RF/v1_2');
var irr = dataset.filterDate('2023-01-01', '2023-12-31').mosaic();

var visualization = {
  min: 0.0,
  max: 1.0,
  palette: ['blue']
};
Map.addLayer(irr, visualization, 'IrrMapper 2023');
Map.setCenter(-112.516, 45.262, 10);