Page Summary
-
This dataset provides high-resolution air pollution mapping of multiple pollutants in California from 2015 to 2019.
-
Data was collected using four Google Street View vehicles equipped with Aclima measurement technology.
-
The dataset includes concentrations of NO, NO2, O3, CH4, CO2, BC, PN2.5, and UFP.
-
Mapping occurred in specific regions of California, including the San Francisco Bay Area, Los Angeles, and the northern San Joaquin Valley.
-
Each data point includes pollutant concentration, geolocation, and car information.
- Dataset Availability
- 2015-05-28T00:00:00Z–2019-06-07T00:00:00Z
- Dataset Producer
- Google / Aclima
- Tags
Description
This large vector dataset contains high resolution air pollution mapping of NO, NO2, O3, CH4, CO2, BC, PN2.5, and UFP concentrations in California between June 2015 and June 2019.
The dataset consists of measurements collected using four Google Street View vehicles equipped with the Aclima mobile measurement and data integration platform from 2015-05-28 to 2019-06-07. Not all four cars were actively mapping over the entire time frame. Note that there may be gaps in the data when an individual car was not mapping due to operational, mechanical, or system difficulties.
Dates of operation for each of the four cars:
- Car A: 2016-05-03 - 2019-04-30
- Car B: 2016-05-03 - 2018-06-08
- Car C: 2015-05-28 - 2019-06-07
- Car D: 2015-06-24 - 2018-11-05
Data was collected in several geographic regions of California including the San Francisco Bay Area, Los Angeles, and the northern San Joaquin Valley. Mapping occurred in targeted neighborhoods or cities within these regions. The data set contains a table titled "California_Unified_2015_2019" which consists of the concentration of the pollutants Ozone (O3), Nitrogen Dioxide (NO2), Nitrogen Monoxide (NO), Methane (CH4), Carbon Dioxide (CO2), Black Carbon (BC), particle number less than 2.5 micrometers in size (PN2.5), and Ultrafine Particles (UFP) measured using four Google Street View cars equipped with fast time-response, laboratory-grade instruments. The data was collected at 1-Hz time resolution from 20150528 to 20190607 for roads in three regions of California - the San Francisco Bay area, Los Angeles, and the northern San Joaquin Valley. Specific areas mapped varied by region based on desired spatial data coverage and science questions. Each data point is geolocated with latitude and longitude as well as the identity and speed of the car.
For details including methodologies, standards, data providers, metadata field definitions and descriptions, refer to the metadata.
Table Schema
Table Schema
| Name | Type | Description |
|---|---|---|
| BC | DOUBLE | Black carbon concentration |
| CH4 | DOUBLE | Methane dry air mixing ratio |
| CO2 | DOUBLE | Carbon dioxide mixing ratio |
| Car_Identifier | STRING | Unique identifier for the four vehicles (Car_A/B/C/D) |
| Car_Speed | DOUBLE | Car speed |
| Date_Time | STRING | Time in UTC, format YYYY-MM-DD hh:mm:ss |
| Metadata_Link | STRING | Link to the document |
| NO | DOUBLE | Nitrogen monoxide mixing ratio |
| NO2 | DOUBLE | Nitrogen dioxide mixing ratio |
| NO2_Overrange | STRING | Boolean flag indicating the measured value was higher than the operating range of the instrument's specification. This field can be empty. |
| NO_Overrange | STRING | Boolean flag indicating the measured value was higher than the operating range of the instrument's specification. This field can be empty. |
| O3 | DOUBLE | Ozone mixing ratio |
| PN1 | DOUBLE | Particle number concentration between 0.3 and 0.5 μm |
| PN2 | DOUBLE | Particle number concentration between 0.5 and 0.7 μm |
| PN3 | DOUBLE | Particle number concentration between 0.7 and 1.0 μm |
| PN4 | DOUBLE | Particle number concentration between 1.0 and 1.5 μm |
| PN5 | DOUBLE | Particle number concentration between 1.5 and 2.5 μm |
| PN_Overrange | STRING | Boolean flag indicating the measured value was higher than the operating range of the instrument's specification. This field can be empty. |
| UFP | DOUBLE | Total particle number concentration greater than 3 nm |
| UFP_Overrange | STRING | Boolean flag indicating the measured value was higher than the operating range of the instrument's specification. This field can be empty. |
Terms of Use
Terms of Use
Citations
with the text "Air Quality Data from Google and Aclima"
Citation for publications: Google and Aclima 2019: Project Air View California 2015-2019
Explore with Earth Engine
Code Editor (JavaScript)
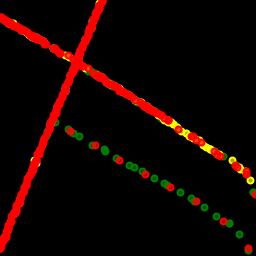
var fc = ee.FeatureCollection('GOOGLE/AirView/California_Unified_2015_2019');

var normal = fc.filter('NO2 >= 0 && NO2 < 1');
var mild = fc.filter('NO2 >= 1 && NO2 < 2');
var strong = fc.filter('NO2 >= 2');

Map.addLayer(normal, {color: 'green'}, 'NO2 [0; 1)');
Map.addLayer(mild, {color: 'yellow'}, 'NO2 [1; 2)');
Map.addLayer(strong, {color: 'red'}, 'NO2 >= 2');
Map.setCenter(-122.827746, 38.4001353, 20);
Map.setOptions('SATELLITE');