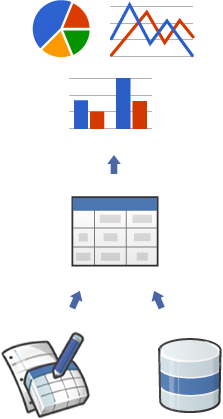
Google 图表是将您网站上的数据可视化的利器。 从简单的折线图到复杂的分层树形图,图表库提供了大量现成可用的图表类型。
使用 Google 图表的最常见方法是嵌入网页中的简单 JavaScript。您可以加载一些 Google 图表库,列出要绘制图表的数据,选择自定义图表的选项,最后使用您选择的 id 创建图表对象。然后,在该网页中后面的位置创建包含该 id 的 <div> 以显示 Google 图表。
以上就是开始使用的所有信息。
图表以 JavaScript 类的形式公开提供,Google 图表提供许多图表类型供您使用。默认外观通常符合您的需求,您可以随时自定义图表,使其与您网站的外观和风格相称。图表是高度互动的,可显示事件,从而使您能够创建复杂的信息中心或其他与网页集成的体验。 图表使用 HTML5/SVG 技术呈现,以提供跨浏览器兼容性(包括适用于旧版 IE 的 VML),以及跨平台兼容 iPhone、iPad 和 Android 平台。您的用户永远不必处理插件或任何软件。 如果他们有网络浏览器,则可以看到您的图表。
所有图表类型都会使用 DataTable 类填充数据,因此,当您进行实验以找到理想的外观时,您可以轻松地在图表类型之间切换。 DataTable 提供了排序、修改和过滤数据的方法,可以直接从您的网页、数据库或支持 Chart Tools Datasource 协议的任何数据提供商填充。 (该协议包含类似 SQL 的查询语言,由 Google 电子表格、Google Fusion Tables 和第三方数据提供商(如 SalesForce)实现。您甚至可以在自己的网站上实现该协议,并成为其他服务的数据提供商。)
准备好创建您的第一个图表了吗?请参阅快速入门。
我们的工具会不断改进,以便更好地满足您的需求;我们期待您的反馈,以帮助我们确定应优先添加哪些功能。 加入我们的论坛。